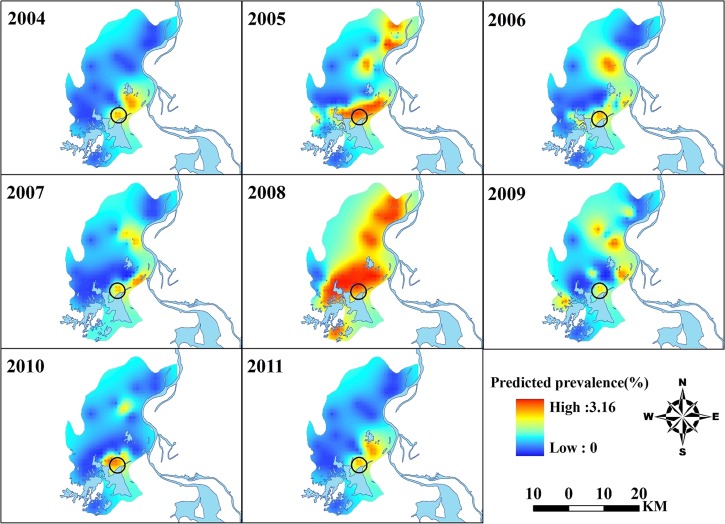
Figure 4.
Annual predicted prevalence of the predictions of schistosomiasis during 2004–2011 in Xingzi, Jiangxi, China. The black circle in each panel delineates a cluster of infection; the geographic layer of the water body was overlaid. The maps were created by using AcrGIS software version 10.0 (ESRI Inc., Redlands, CA).

