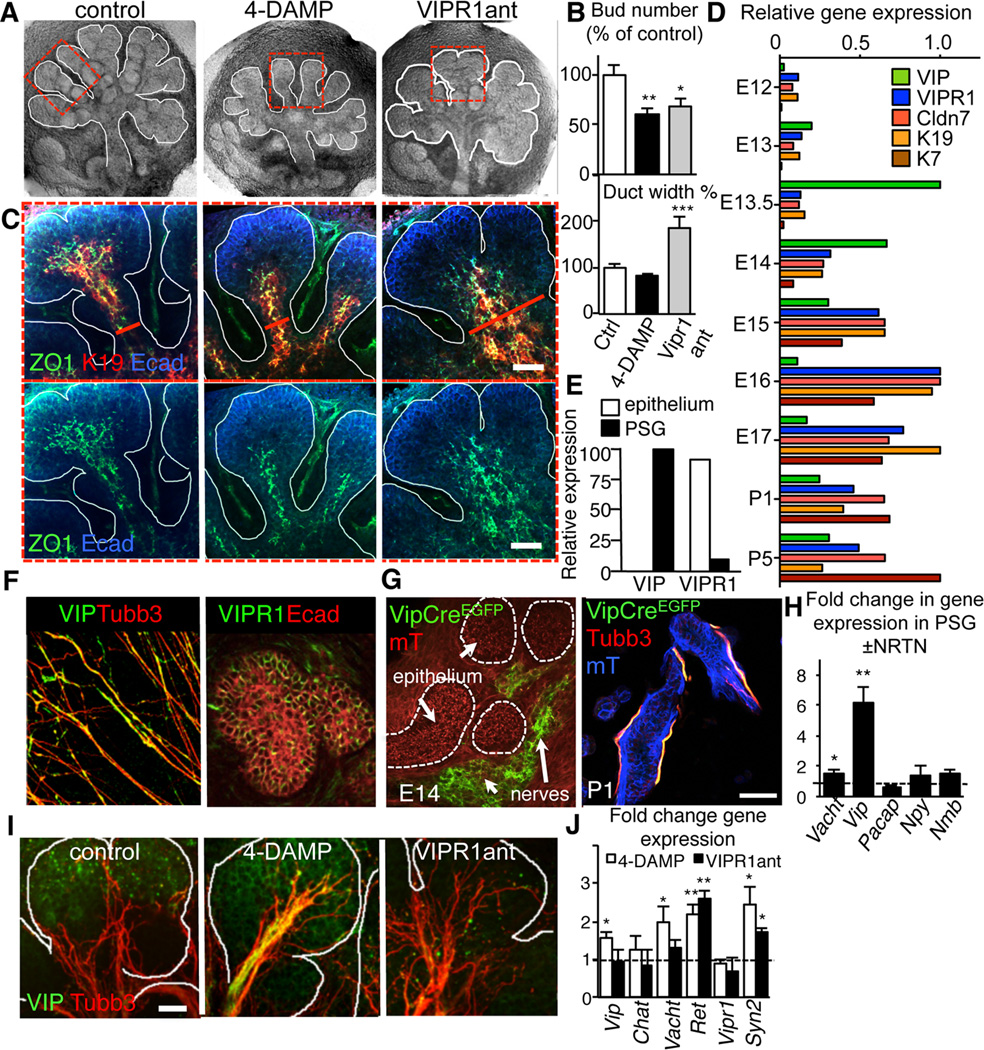
Figure 2. Ductal tubulogenesis requires VIP/VIPR1 but not ACh/M1 signaling.
(A–D) E13 SMG were cultured with the muscarinic receptor antagonist, 4-DAMP (10 µM) or VIPR1 antagonist (VIPR1ant, 30 µM) for 24 h and, (A) overall architecture of the SMG; (B) branch number and duct width; (C) distribution of K19 (red) and ZO1 (green) with E-cadherin (Ecad, blue); (D) Microarray analysis of gene expression in SMG from embryonic day 12 – 17. Shown are relative expression levels (normalized to the highest expression level). E) SMG epithelial and mesenchymal compartments were separated and expression of VIP and VIPR1 were analyzed by qPCR. (F) E13 PSGs were isolated and immunostained for neurons (Tubb3, red) and VIP (green) or E13.5 SMG were immunostained for E-cadherin (Ecad, red) and VIPR1 (green). (G) Vip-Cre mice were crossed to a Rosa26mTmG reporter strain and the salivary glands analyzed at E14 and P1. Images represent 10–15 µm projections of 1 µm confocal sections. Scale bar = 50 µm. (H) E13 PSG were treated with 10ng/ml NRTN for 24h and changes in gene expression quantified by qPCR. (I and J) E13 SMG were cultured with the muscarinic receptor antagonist, 4-DAMP (10 µM) or VIPR1 antagonist (VIPR1ant, 30 µM) for 24 h and (I) neuronal outgrowth (Tubb3; red) and VIP protein (green) or (E) expression of neuronal marker transcripts were analyzed. In E, control expression was set to 1 (dashed line). Fluorescent images are 12 µm projections of 1 µm sections (in C) or 25 µm projection of 1.5 µm sections (in D). Scale bars: C = 50 µm; D = 20 µm. In B and E, data are means ± s.d. for 3 experiments. In B, data were analyzed using a one-way analysis of variance with post hoc Dunnett’s test; in E, a false discovery rate (Q) for multiple unpaired t-tests was set to 5%; *P<0.05; **P<0.01; ***P<0.001.
See also Figure S2.

