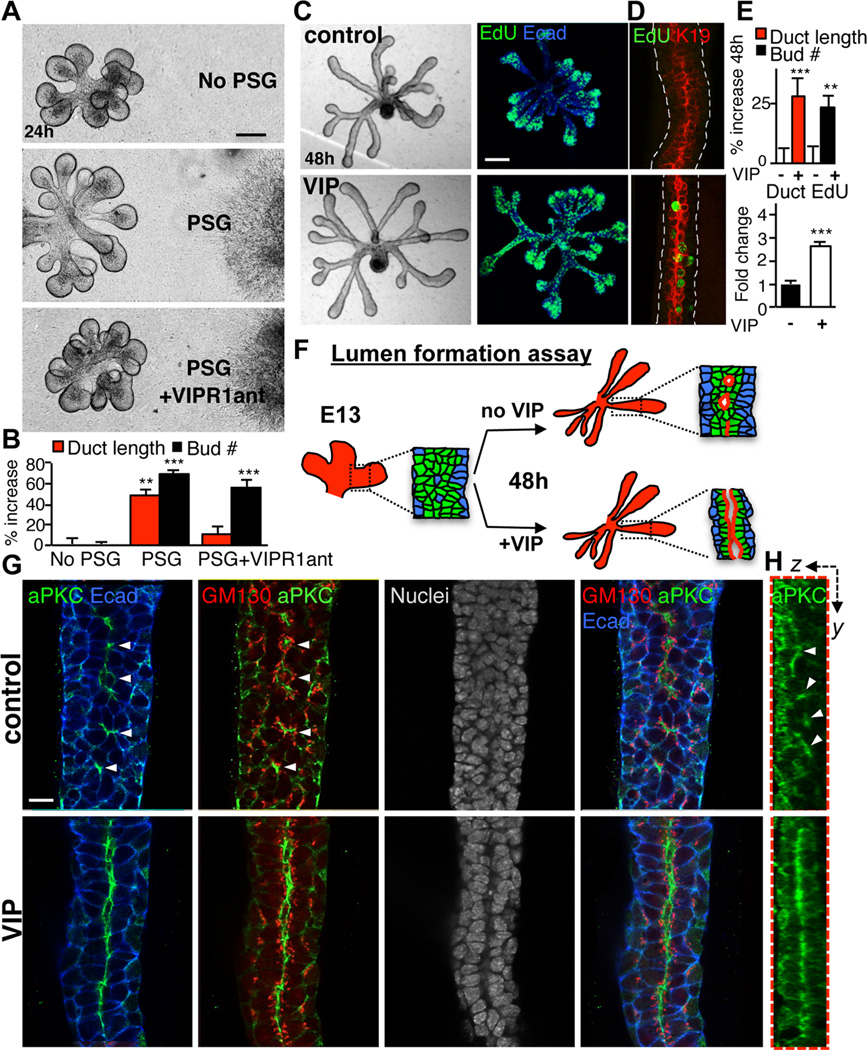
Figure 3. PSG-derived VIP promotes ductal growth and formation of a contiguous lumen.
(A and B) E13 epithelia were co-cultured with isolated PSGs for 24 h ±VIPR1ant (30 µM). Representative images are shown in A; duct length and branch number were measured and quantified in B. Scale bar = 100 µm. (C–E) VIP promotes proliferation of ductal cells, ductal elongation and branching. Epithelia were cultured ±VIP (200 nM) for 48 h. The majority of EdU(+) with VIP treatment were luminal K19(+) cells (D). EdU-positive cells were counted and normalized to ductal area (E, lower graph). Fluorescent image is a 60 µm projection of 4 µm confocal sections. Scale bar = 100 µm. (F) Schematic illustration of the lumen formation assay and observed experimental outcomes shown in G. (G) Apical-basal polarity was analyzed by immunolabeling for aPKC, apical membrane marker; E-cadherin, basolateral membrane marker; GM130, Golgi marker and Dapi, nuclei. Single 1.5 µm sections. Scale bar = 10 µm. (H) Z-sections along Y-axis. Arrowheads point to microlumens. Image is a 30 µm projection of 0.4 µm confocal sections. In (B and E), data are means ± s.d. of 3 experiments. In B, data was analyzed using a one-way analysis of variance with post hoc Dunnett’s test. In E, a Students t-test was performed; ***P<0.001, **P<0.01, *P<0.05.
See also Figure S3.

