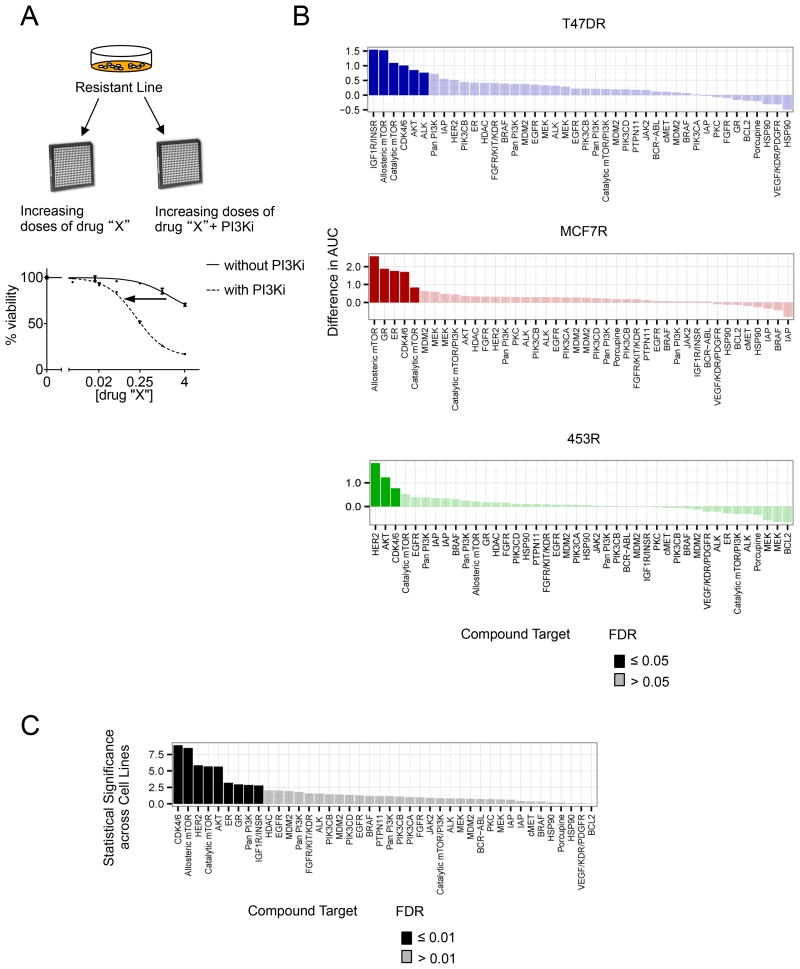
Figure 2. Combinatorial Drug Screen to identify sensitizers to PI3K inhibition in resistant PIK3CA mutant cell lines.
A) An outline of the drug screening protocol. Resistant cells were seeded in 96 well plates and treated in triplicate with escalating doses of each of the 42 compounds in the drug screen, either singly or in combination with 1 μM dose of PI3Ki.
B) For each of the resistant cell lines, dose response curves to the targeted agents were generated, in the absence or presence of 1 μM of BYL719 for T47DR and 453R or GDC-0941 for MCF7R. The agents were ranked according to greatest difference in area under the curve (AUC) between these two dose response curves for each cell line. Targets of each agent, ranked by difference in AUC, are depicted for each cell line. Darkened values indicate statistically significant sensitizers (FDR<0.05).
C) Data from all three resistant cell lines were pooled and ranked by statistical significance (-log (p-value)). Darkened values indicate statistically significant sensitizers (FDR<0.01).
See also Figure S2 and Table S2.

