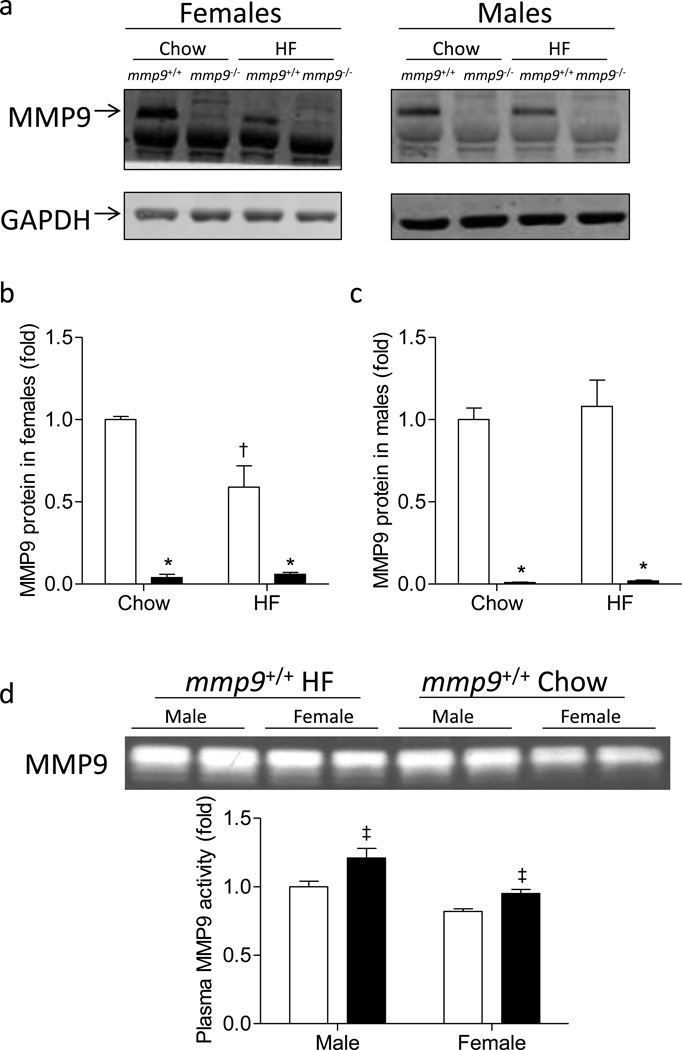
Figure 1. Protein expression of MMP9 in the skeletal muscle and plasma MMP9 activity.
Gastrocnemius muscle was freeze-clamped following the ICv and was measured for the protein expression of MMP9 by Western Blotting. GAPDH was used as an internal control. (a) Representative bands. (b-c) Quantitative data. Data were normalized to GAPDH expression and presented as fold of chow-fed mmp9+/+. White bars for mmp9+/+ and black bars for mmp9−/−. (d) Gelatin zymography of plasma in mmp9+/+ mice after chow feeding (white bars) or HF feeding (black bars) for 20 weeks. N is equal to 3–6 for the female mice and 5–6 for the male mice. *p<0.05 when compared to mmp9+/+ mice with the same diet; †p<0.05 when compared to chow-fed mice with the same genotype; ‡p<0.05 when compared to chow-fed mice with the same gender.

