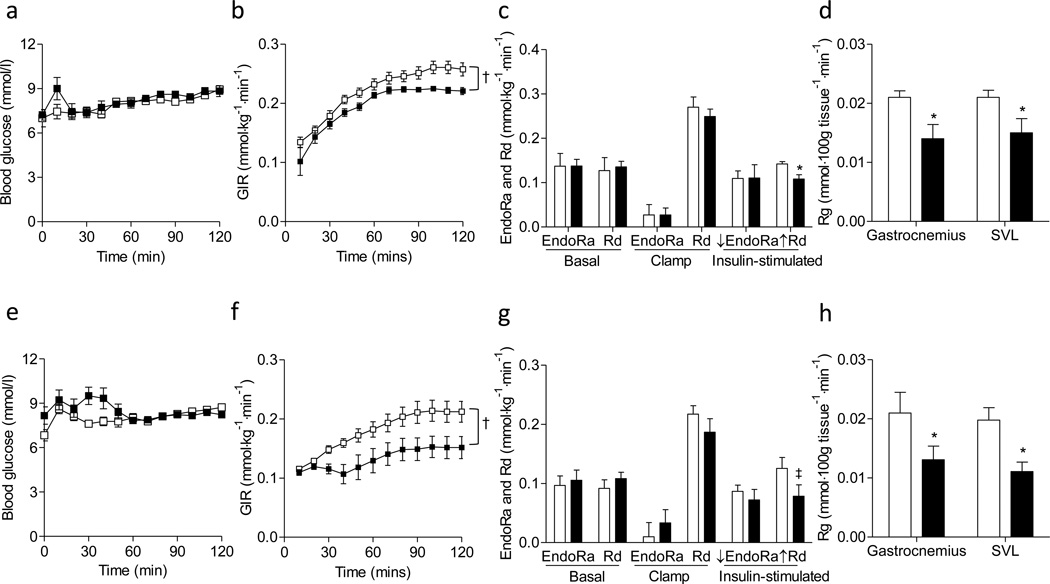
Figure 5. Insulin sensitivity in the HF-fed mice.
Hyperinsulinemic-euglycemic clamps were performed in HF-fed mice determining the insulin action. (a-d) Data from female mice. (e-h) Data from male mice. (a, e) Blood glucose, (b, f) glucose infusion rate (GIR), (c, g) endogenous glucose production (EndoRa), glucose disappearance rate (Rd), and insulin-stimulated suppression of EndoRa (↓EndoRa) and insulin-stimulated increase in Rd (↑Rd), and (d, h) a glucose metabolic index (Rg) in muscles were shown. White squares/bars for mmp9+/+ and black squares/bars for mmp9−/−. N is equal to 6 for both female and male mice. †p<0.05 with genotype. *p<0.05 when compared to mmp9+/+. ‡p=0.06 when compared to mmp9+/+.

