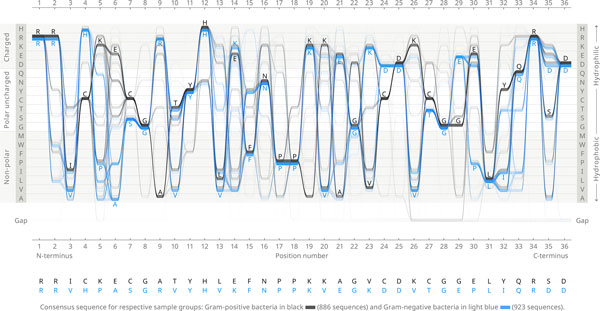
Figure 1.

Sequence Bundles comparing amino acid distribution and correlation in the AKL domain. Bundled visualisation plots sequences as stacked lines against a Y-axis of letters arranged on a scale representing amino acid hydrophobicity. The lines' curved paths expose the conservation of residues by converging at matched positions. Their place relative to letters on the Y-axis exposes patterns in functionality. The consensus sequence is indicated. Lines representing two groups of organisms differ by colour: Gram-positive bacteria (black lines) and Gram-negative bacteria (blue lines). The visualisation is generated from a total of 1809 AKL protein sequences. The number of samples is: 923 Gram-negative sequences vs. 886 Gram-positives, which is in 100:96 ratio.
