
Figure 2.
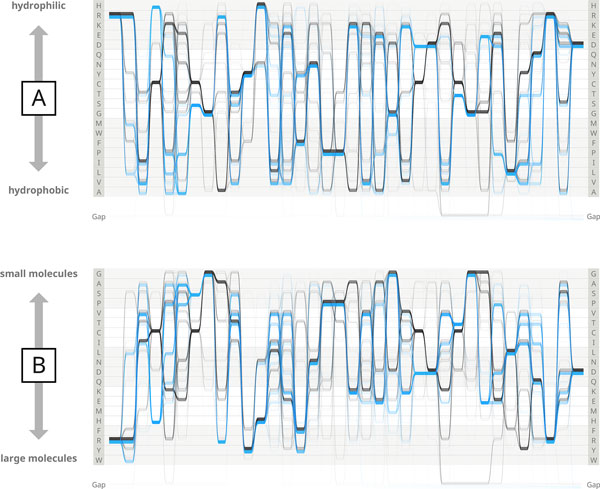
Comparison of two Sequence Bundles plots differentiated by the Y-axis organisation. Reorganising the Y-axis by different principles enables a more in-depth exploration of visualised data and assists in finding meaningful links between data alignment and the physical properties of amino acids displayed in the sequence. Panel A shows the Sequence Bundles visualisation of the AKL domain with the Y-axis organised according to amino acid hydrophobicity (hydrophilic to hydrophobic residues arranged top to bottom after Wampler [12]). Panel B shows the Sequence Bundles visualisation of the same dataset with the Y-axis organised according to amino acid molecule weight (small to large molecules arranged top to bottom after Lide [14]).