
Figure 2.
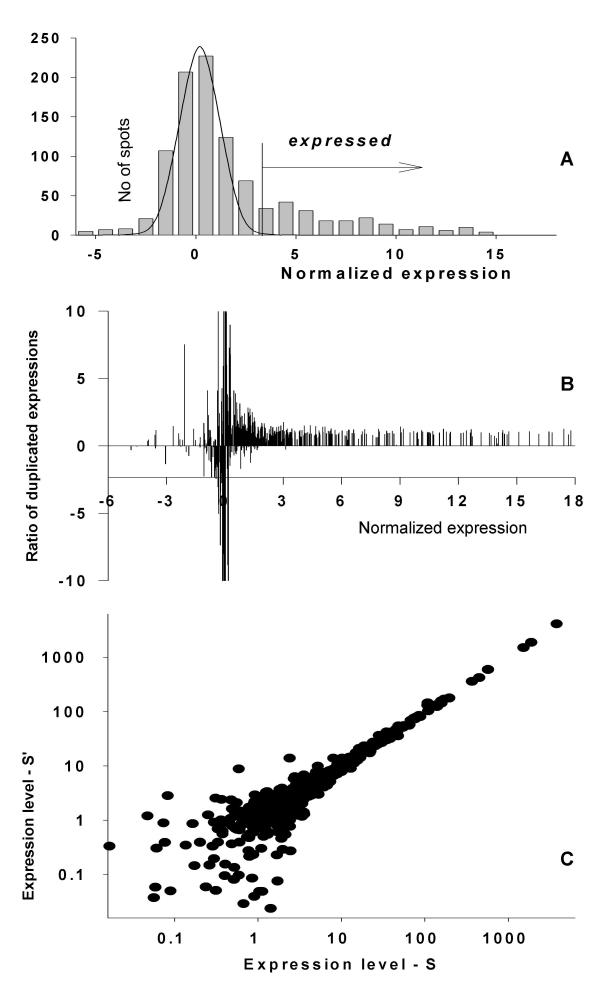
"Contamination" of the normally distributed additive noise with weak expressions on Micromax cDNA arrays. A. Histogram of gene expression distribution. B. The variability of the gene expressions ratios on two arrays ordered by expression levels. C. Scatter plot of gene expressions used in the calculation of ratios in B with gene order preserved.