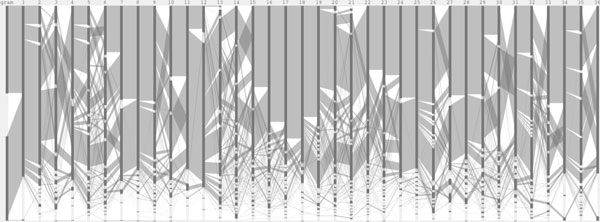
Figure 3.

Sequence diversity diagram of the adenylate kinase lid domain. The sequence positions are laid horizontally on the x-axis and the residue groupings are shown on the y-axis. The Sequence Diversity Diagrams represent two samples, color-coded and overlaid on top of each other. The line weight represents the relative frequency of residues at the two consecutive positions with respect to the total number of sequences.
