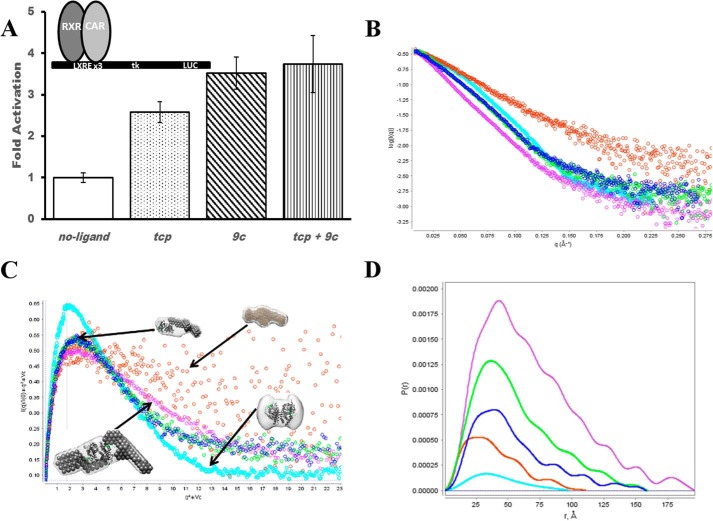
FIGURE 1.
Activity and assembly of CAR:RXR. A, transactivation of CAR:RXR measured in CV-1 cells on 4 copies of liver X receptor response element. Significance in differences in activity between samples was measured by a two-tailed Welch test, and all differences are highly significant (p < 0.05), except tcp versus tcp+9c (p = 0.11) and 9c versus tcp+9c (p = 0.67). B, scattering curve normalized to I(0) to show differences in size and deviation from globular shape. CAR:RXR, cyan; SRC, orange; CAR:RXR·SRC, blue; CAR(tcp):RXR·SRC, green; CAR(tcp):RXR(9c)·SRC, purple. C, Vc-based Kratky plot for visualization of flexibility and surface area to volume ratio. Molecular shapes are generated by MONSA, whereas the individual heterodimer and coactivator envelopes are generated by DAMMIN. D, P(r) distribution. The pairwise distribution of atoms within the complexes gives overall complex size. Greater deviation from a Gaussian distribution indicates an extended structure. CAR:RXR, cyan; SRC, orange; CAR:RXR·SRC, blue; CAR(tcp):RXR·SRC, green; CAR(tcp):RXR(9c)·SRC, purple.

