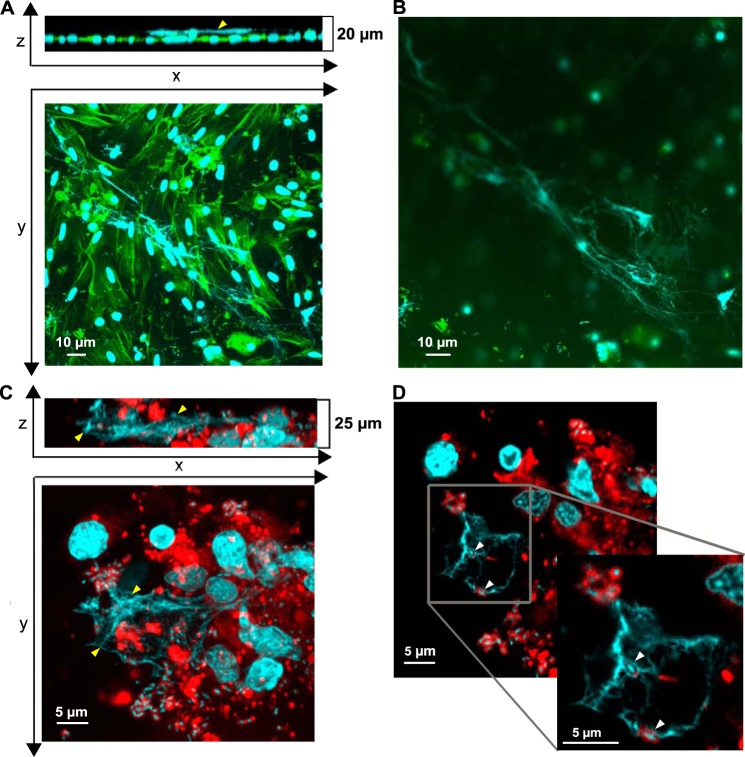
FIGURE 6.
Oyster hemocytes release DNA extracellular traps in which bacteria are entrapped. A and B, DNA ETs released by oyster hemocytes challenged for 1 h with V. tasmaniensis LGP32. Confocal microscopy images were acquired after staining of DNA with DAPI (blue) and filamentous actin with phalloidin-Alexa Fluor 448 (green). A, projections of a z stack and a y stack made from 20 confocal sections. An extracellular DNA ET can be observed extending from 5 to 10 μm above the layer of adherent hemocytes (yellow arrowhead). B, an upper confocal section depicting the longest ET observed in the preparation. C and D, bacteria entrapped in ETs of hemocytes challenged for 1 h with V. tasmaniensis LGP32. Confocal microscopy images were acquired after staining of DNA with DAPI (blue) and cellular membranes with WGA-TRITC (red). C, projections of a z stack and a y stack made from 125 confocal sections. ETs stained with DAPI (yellow arrowheads) were observed in areas with a high bacterial density and extending up to 10 μm above adherent hemocytes. D, bacteria were found entrapped in ETs (white arrowheads), as revealed by their blue nucleic acid staining (DAPI) and red membrane staining (WGA-TRITC) on one representative confocal section of 0.2-μm thickness. See Online supplement 1 for full z-stack.

