
FIGURE 8.
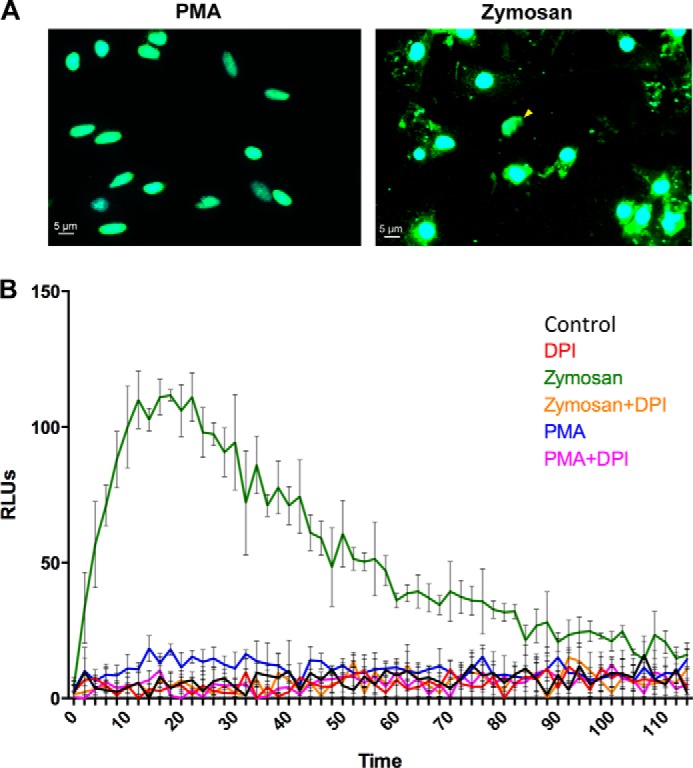
Zymosan but not PMA induces ROS production and ET formation by oyster hemocytes. A, representative photographs of the hemocyte response to stimulation with PMA or zymosan. Epifluorescence microscopy images were acquired after staining of DNA with DAPI (blue) and immunostaining of C. gigas H5-like histones (green). The extranuclear histones and ETs observed in zymosan-stimulated samples are absent in PMA-stimulated samples. B, ROS production was monitored in control hemocytes (black line) and after hemocyte stimulation with PMA (blue line) or zymosan (green line). The inhibition of ROS production by DPI treatment was monitored in control hemocytes (red line), PMA-stimulated hemocytes (pink line), and zymosan-stimulated hemocytes (orange line). Results are expressed in relative luminescence units (RLUs) indicative of luminol oxidation. Averages and standard deviations were calculated from three independent experiments.