FIGURE 2.
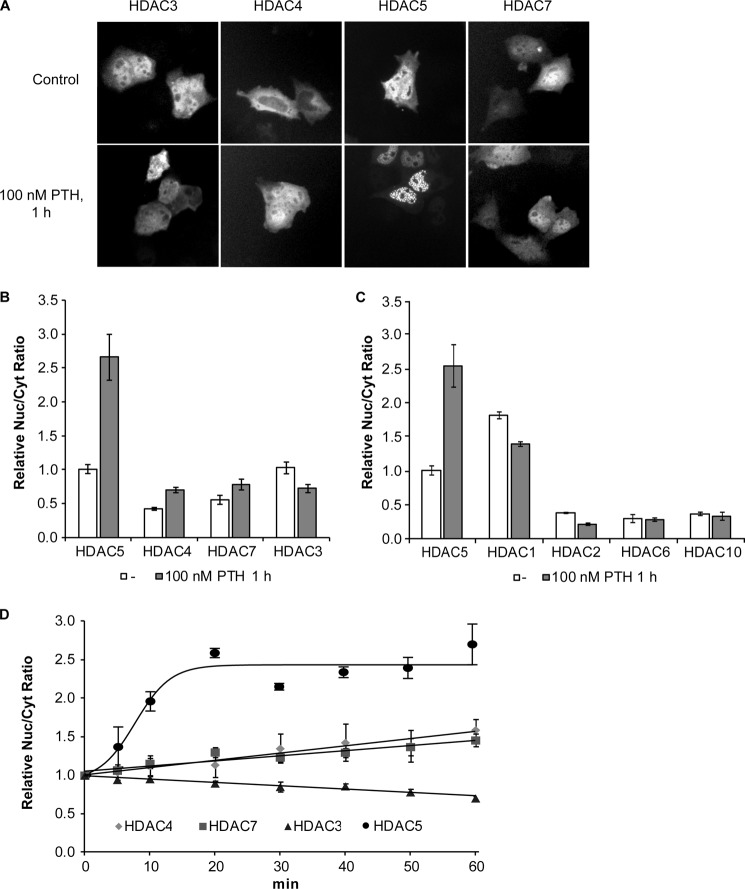
PTH specifically induces a rapid and strong nuclear localization of HDAC5. A, UMR106 cells were transfected with HDAC-GFP expression vectors for HDAC3, -4, -5, and -7 and their subcellular distributions were analyzed using fluorescence microscopy and HCA. Representative green fluorescence images are shown of transfected non-treated cells (upper panel) and transfected cells stimulated with 100 nm PTH for 1 h (lower panel). B, the ratio between nuclear and cytoplasmic localization (Nuc/Cyt ratio) was individually determined for transfected cell. Shown are the mean ± S.E. of at least four independent experiments relative to HDAC5, which was taken as 1. C, HCA of the subcellular distribution of FLAG-tagged HDAC1, -2, -5, -6, and -10 expressed in UMR106 cells in the absence or presence of 100 nm PTH. D, time courses of the effect of 100 nm PTH on HDACs nuclear to cytoplasmic localization. Shown are relative Nuc/Cyt ratios normalized to time 0. Each data point is the mean ± S.E. of at least three independent experiments.

