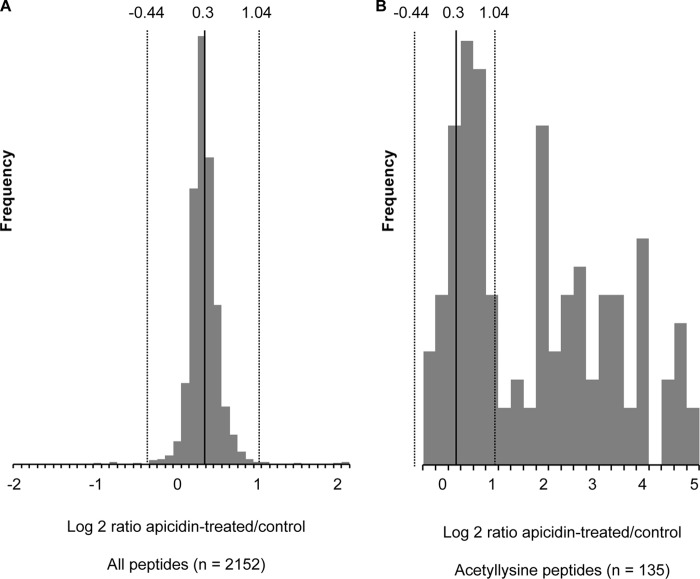
FIGURE 9.
Analysis of whole cell protein acetylation in response to apicidin treatment of UMR106 cells. Protein acetylation was analyzed by SILAC-based quantitative mass spectrometry of immuno-enriched acetyllysine peptides. Shown are histogram distributions of the apicidin-treated/untreated ratios for all peptides in the acetyllysine-enriched sample (A) versus only acetyllysine-containing peptides (B). Vertical dotted lines indicate the 95% confidence interval determined for all peptides and applied to acetyllysine-containing peptides (average ± 2 S.D.).

