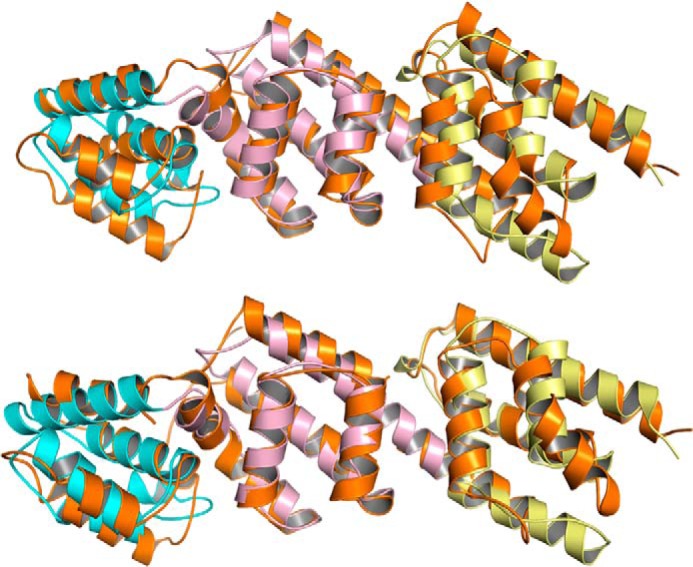
FIGURE 6.

Superposition of MxiC (colored in orange, Protein Data Bank code 2VJ4) on pCopN (colored as in Fig. 5A). The r.m.s. deviation after an overall superposition is 3.9 Å (239 Cαs compared; top), whereas the r.m.s. deviation after a motif-based superposition is 2.8 Å for the first helical repeat (86 Cαs compared), 1.8 Å for the second (90 Cαs compared), and 2.3 Å for the third (91 Cαs compared) (bottom). The lower r.m.s. deviation as compared with that after superposition of the structures as a whole reflects the flexibility at the junction between the repeated motifs.
