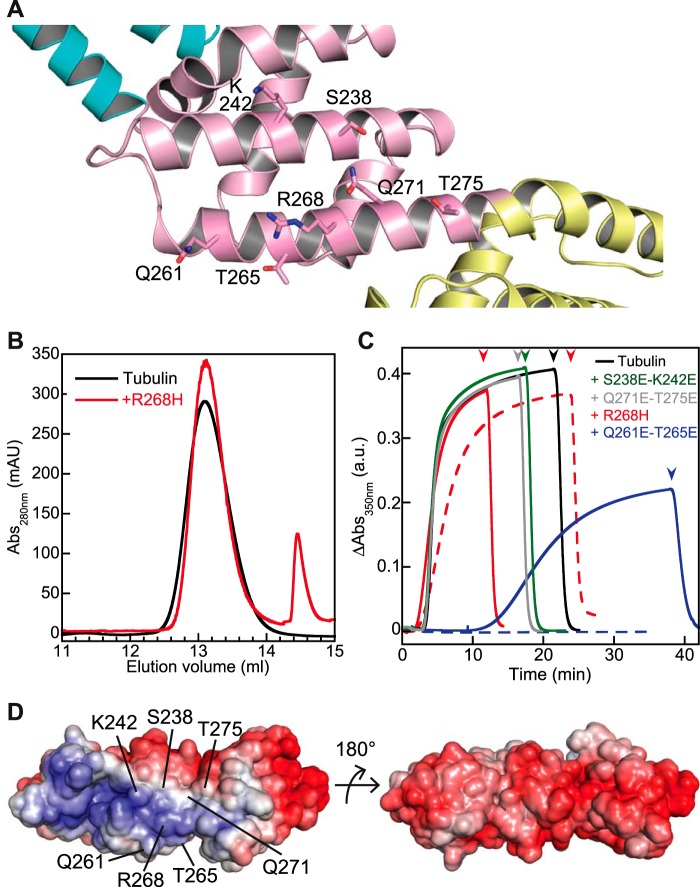
FIGURE 8.
Delineating the pCopN tubulin-interacting surface. A, close-up of the pCopN structure showing the location of the residues mutated in this study. B, the pCopN R268H mutation leads to a protein that does not interact with tubulin, as analyzed by gel filtration. Samples of tubulin either alone (black line) or in the presence of R268H (red line) were loaded on the column. C, microtubule assembly of 20 μm tubulin alone or in the presence of R268H (20 μm (solid line) or 30 μm (dashed line)), of S238E/K242E (40 μm), of Q261E/T265E (20 μm (solid line) or 30 μm (dashed line)), or of Q271E/T275E (40 μm). Arrowheads, temperature switch from 37 to 4 °C. The color code is as shown. D, views of the pCopN molecular surface colored by electrostatic potential (red, negative; blue, positive, ranging from −7 to 7 kBT). Left, view of the surface comprising the mutated residues. Right, view along the same orientation as in Fig. 5A. a.u., arbitrary units; mAU, milliabsorbance units.

