
Figure 1.
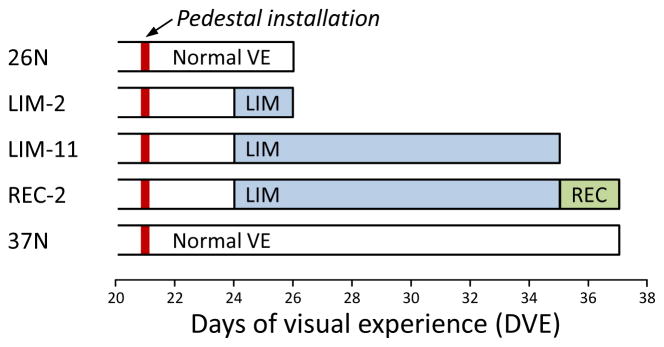
Experimental groups and duration of treatments. The red vertical bar indicates the point when a dental acrylic pedestal was installed under anesthesia. Filled regions indicate the type and duration of visual treatment. The right end of each bar indicates the time point when mRNA levels were measured.