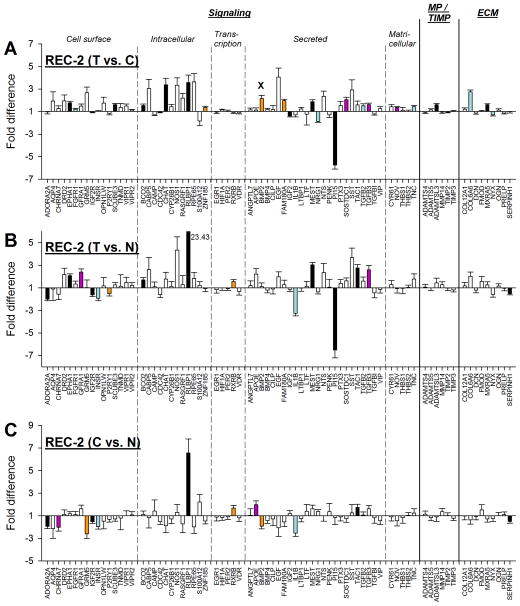
Figure 8.
Gene expression fold differences. (A) Treated eyes vs. control eyes after 2 days of recovery from full compensation to minus-lens wear. (B) Treated eyes vs. normal (37N) eyes. (C) Control eyes vs. normal (37N) eyes. Symbols as in Figure 4. In A, the “x” indicates that the significant treated-eye vs. control-eye up-regulation of one gene (BMP2) was produced by decreased mRNA expression in the control eyes. In B, the off-scale fold difference for RLBP1 (23.43) is indicated next to the bar.

