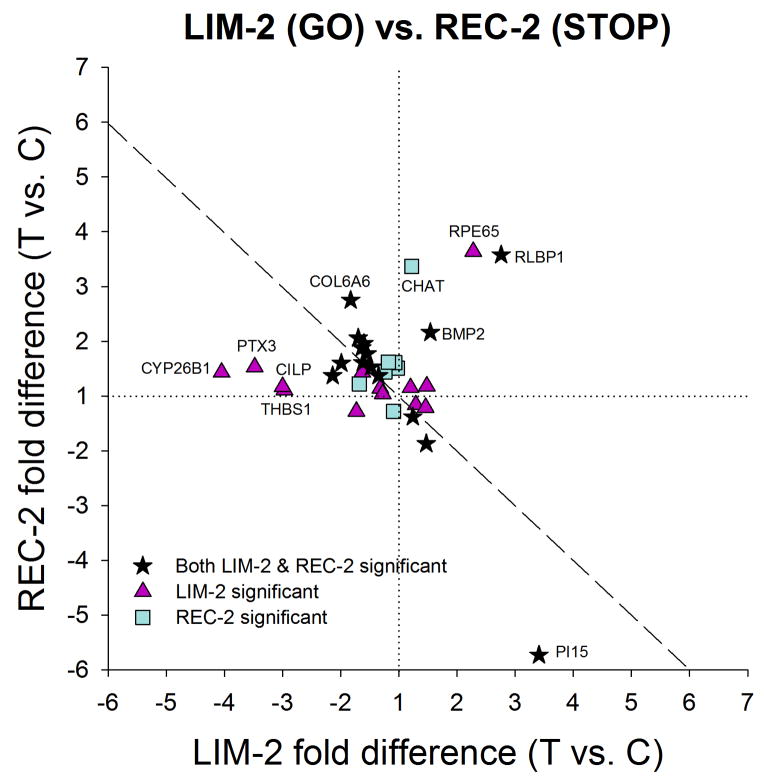
Figure 9.
Comparison of the gene expression differences (treated eye vs. control eye) in Fig. 5A (LIM-2) with the differences in Fig. 8A (REC-2), showing that the gene expression patterns in GO and STOP were very different. Highly-regulated genes are labeled. Values near the dashed line indicate genes that responded with opposite fold-differences in the two conditions. Stars = significant fold differences for both LIM-2 and REC-2; triangles = significant fold differences only for LIM-2; squares = significant fold differences only for REC-2.

