Figure 1.

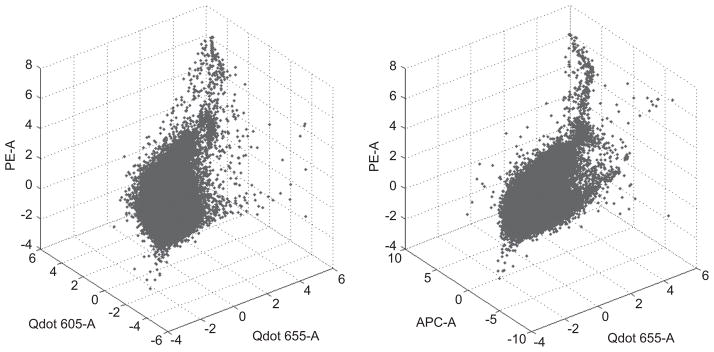
3D scatter plots of a randomly selected subset of the FCM data of Section 5.1 on 3 reporters. Left: Qdot 655-A vs. Qdot 605-A vs. PE-A. Right: Qdot 655-A vs. APC-A vs. PE-A.

3D scatter plots of a randomly selected subset of the FCM data of Section 5.1 on 3 reporters. Left: Qdot 655-A vs. Qdot 605-A vs. PE-A. Right: Qdot 655-A vs. APC-A vs. PE-A.