
Figure 10.
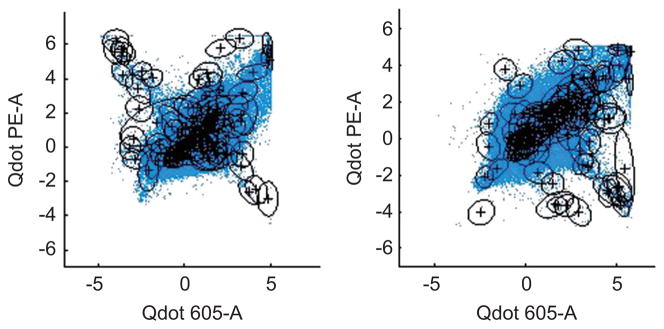
Scatter plots of the real data. The contours are the 2-dimensional margins on each Gaussian component in the full 10-dimensional mixture.
Official websites use .gov
A
.gov website belongs to an official
government organization in the United States.
Secure .gov websites use HTTPS
A lock (
) or https:// means you've safely
connected to the .gov website. Share sensitive
information only on official, secure websites.
Scatter plots of the real data. The contours are the 2-dimensional margins on each Gaussian component in the full 10-dimensional mixture.