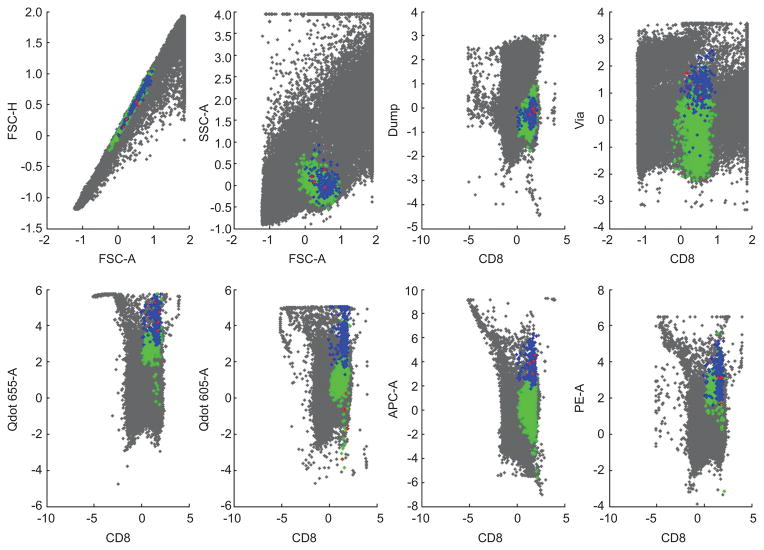
Figure 11.
Identified clusters of interest. A subset of the data is shown in gray. CMV, EBV and FLU groups are plotted in green, red, and blue, respectively. The identified three groups contain 2849, 4 and 216 observations, respectively. The group with 4 events does not meet the cut-off of 10 events and 0.002% of CD8 for positive events we have suggested (Andersen et al., 2012) and may represent false positive or background events.

