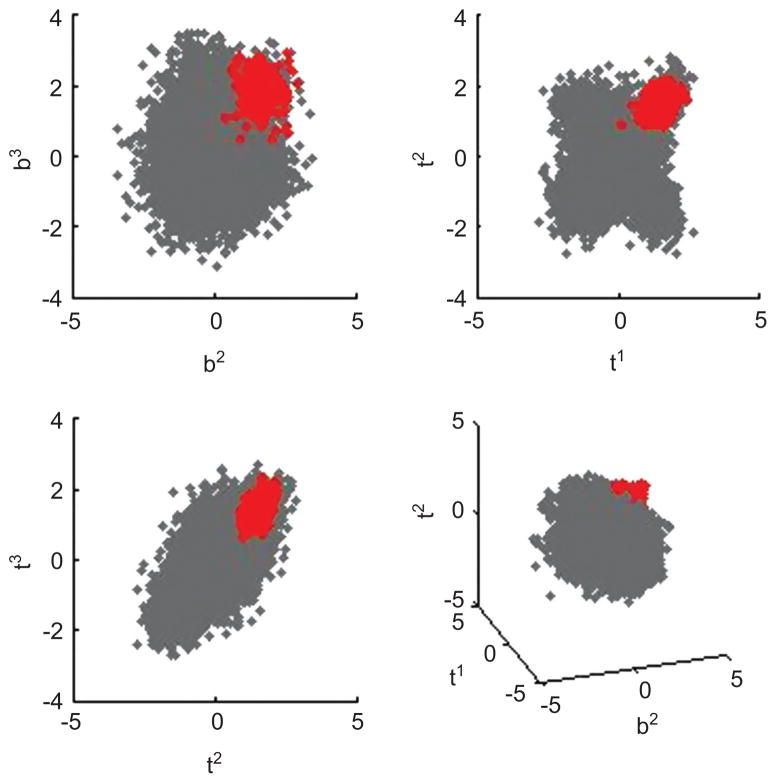
Figure 3.
Pairwise scatter plots and one 3-dimensional scatter plot of simulated data. The cluster of cells of interest is plotted in red. Here bi is the ith dimension in the phenotypic marker subvector, and ti is the ith dimension in the tetramer subvector. The lower right plot indicates that the cluster of interest is the outer layer of the sample under b2, t1 and t2. The other 3 subplots show that the cluster is hard to identify with traditional 2-D gating.

