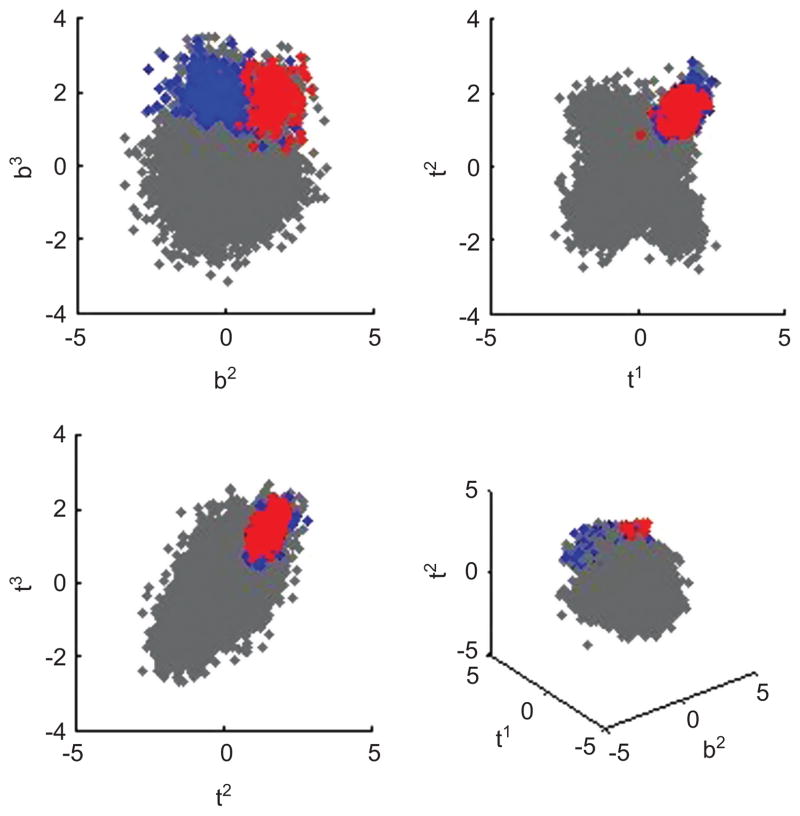
Figure 4.
Scatter plots of synthetic data example as in Figure 3. Using standard DP mixture analysis, a relatively large subtype is identified. Cells assigned to this subtype are colored blue, and this blue region extends to include much of the actual subtype region, in red, in this synthetic data set. The analysis is unable to identify the correct subtype region.

