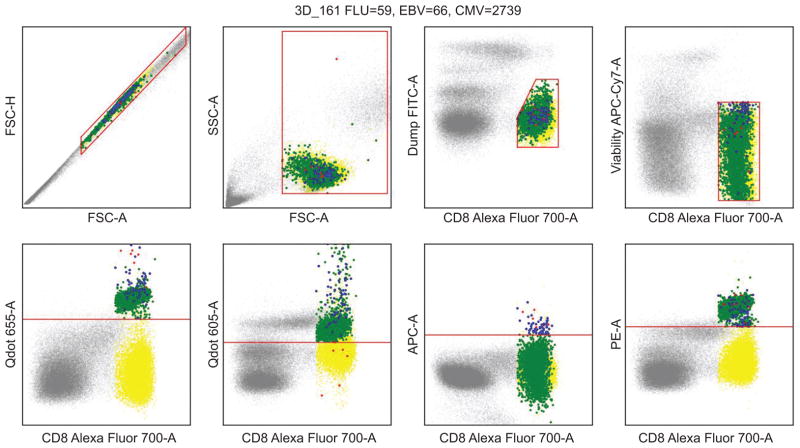
Figure 7.
Reference plot indicating clusters/subtypes of interest in the T-cell human blood data. A subset of the data is shown in gray, CD8+ T cells are plotted in yellow, CMV, EBV and FLU groups are plotted in green, red, and blue, respectively. These latter three identified subtypes contained 2739, 66 and 59 observations, respectively. Subtypes of interest are CD8+ and positive also in the three corresponding multimer features.

