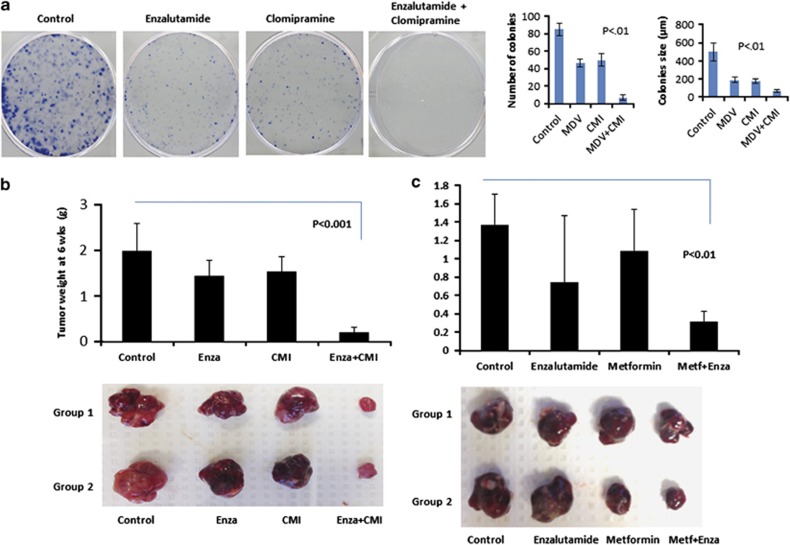
Figure 7.
Inhibiting autophagy pharmacologically enhanced therapeutic response in ENZA-resistant cells in vitro and in vivo using prostate xenograft mouse model. (a) Blockage of antiandrogen-mediated autophagy decreases cells' ability to form colonies. C4-2B cells treated with DMSO, 5 μM CMI, 10 μM ENZA and a combination of CMI and ENZA were plated for the clonogenic assay to evaluate cell survival. Left panels showed quantification of the number of colonies and size of the colonies. Significant difference between the treatment groups were found using t-test (P<0.05). Values represent mean±s.e. (b) Inhibiting autophagy enhanced therapeutic response in ENZA-resistant tumors in prostate xenograft mouse model. ENZA-resistant cells (C4-2B+R, 1.5 × 10⁶ cells) were orthotopically implanted in four groups of SCID mice and randomly divided, with four mice in each group. Mice were treated after detectable PSA with: Control (vehicle only), ENZA, CMI, and ENZA plus CMI. At 6 weeks after implantation, mice were euthanized, and tumors were surgically dissected and weighted. The graph in the upper panel showed the average weight of tumors in each group. Lower panel showed two representative images of the tumors. (c) ENZA-resistant cells (C4-2B+R, 1.5 × 10⁶ cells) were orthotopically implanted in four groups of SCID mice and randomly divided, with 6–8 mice in each group. Mice were treated after PSA became detectable with: Control (vehicle only), ENZA (25 mg/kg), Metformin (300 mg/kg), and ENZA plus Metformin. At 4 weeks after implantation, mice were euthanized, and tumors were surgically dissected and weighed. The graph in the upper panel showed the average weight of tumors in each group. Lower panel showed two representative images of the tumors.

