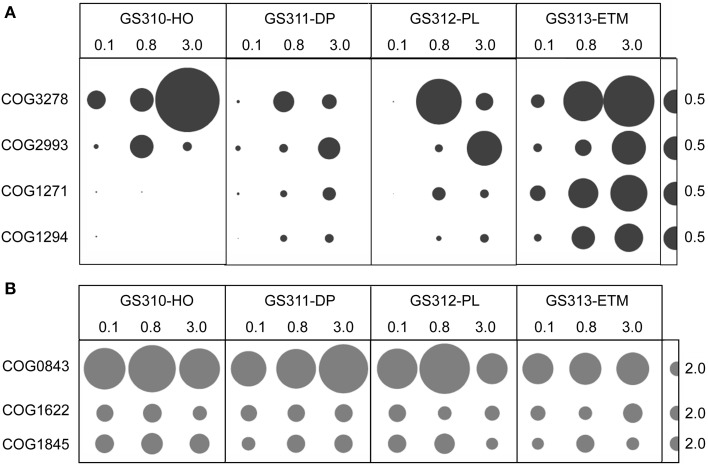
Figure 2.
(A) High-affinity terminal oxidase gene categories: COG3278, Cbb3-type cytochrome oxidase, subunit 1; COG2993, Cbb3-type cytochrome oxidase, cytochrome c subunit; COG1271, Cytochrome bd-type quinol oxidase, subunit 1; COG1294, Cytochrome bd-type quinol oxidase, subunit 2. (B) “Housekeeping” heme/copper-type cytochrome/quinol oxidases: COG0843, subunit 1; COG1622, subunit 2; COG1845, subunit 3. Abundance for a functional gene category was calculated as the number of hits to a given category normalized by average bacterial genome equivalents in the corresponding metagenome. Abundance values are shown by bubble width for each size fraction in each sample. Half-bubbles to the right of each row correspond to 0.5 and 2 genes per average bacterial genome equivalent, in (A,B), respectively. Sample names above the bubble plots are composed of the GS (“global survey”) number of the JCVI sample database and habitat: HO, hypoxic water; DP, deep ocean bottom; PL, plume; ETM, estuarine turbidity maximum. The numbers above the sample names indicate size fractions: 0.1, 0.1–0.8 μm; 0.8, 0.8–3 μm; 3, 3.0–200 μm.

