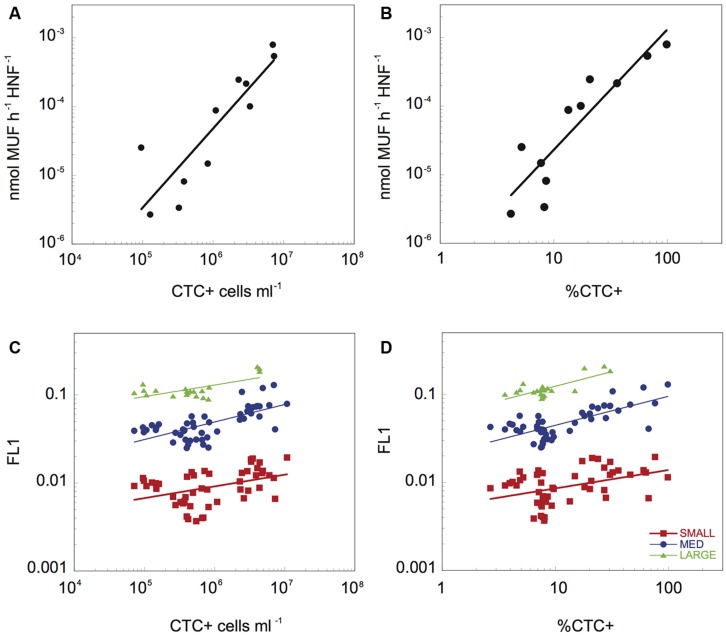
FIGURE 3.
The relationship between β-Gam activity per HNF cell and the abundance (A) and proportion of CTC+ cells (B), and relationship between the average green fluorescence (FL1) associated to the three different HNF populations and the abundance (C) and proportion (D) of CTC+ cells. The data have been log-transformed.

