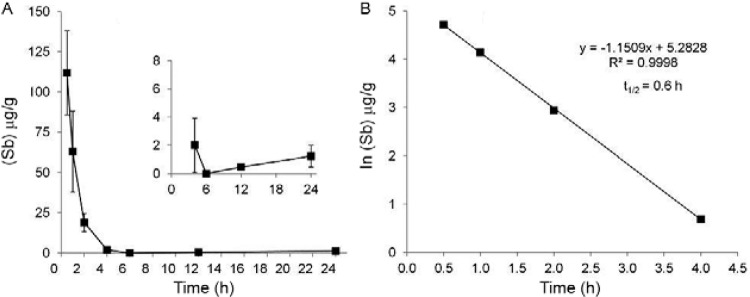
Fig 1A. : time course of antimony (Sb) concentrations (µg/g) in the blood (whole blood) of male rats (n = 6) treated intravenously with a single dose (75 mg SbV/kg body wt) of meglumine antimoniate (MA) [insert: a magnified view of nadir Sb levels at post-injection intervals longer than 6 h (terminal elimination phase)]; B: linear plot of decline in Sb blood levels during the fast elimination phase. Data are shown as natural logarithm of Sb concentration (µg/g) in the blood vs. time after MA administration.

