Figure 1.

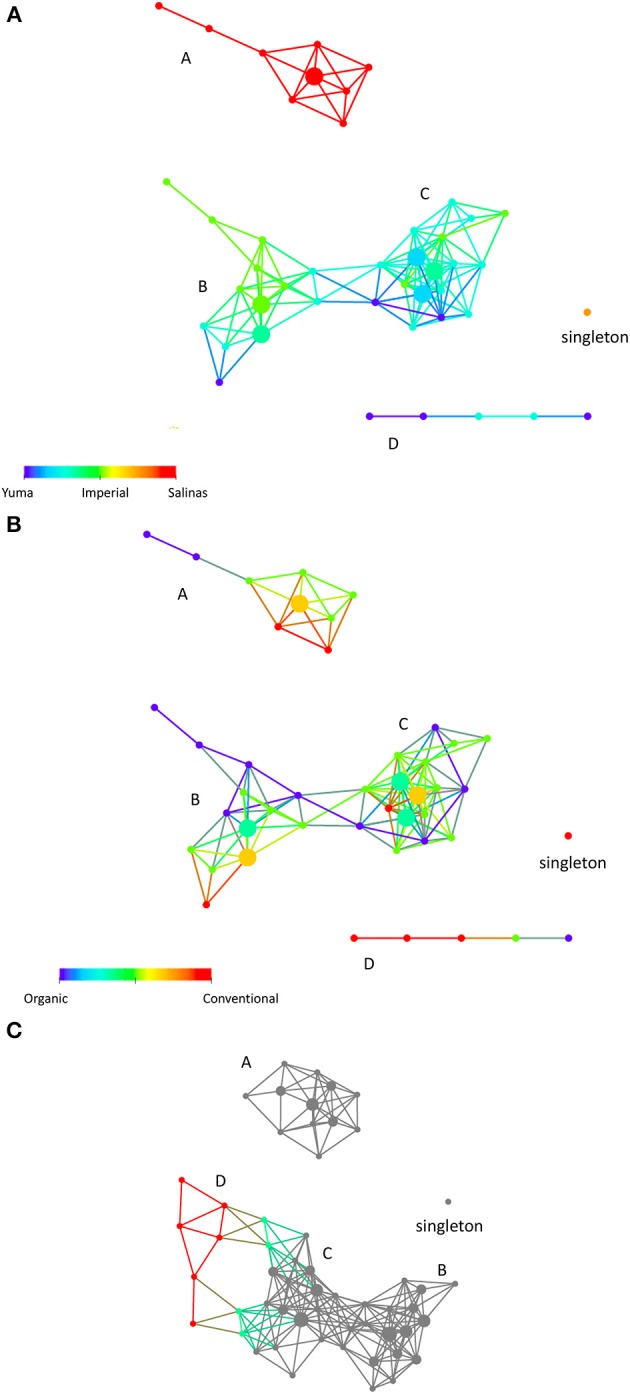
(A) Sample-sample relationships in a topological network. Using physical, chemical, and biological characteristics of the samples, we obtained a network that comprised of 4 sub-networks (A–D) and a singleton (single node comprising of 2 samples). The coloring here is by location, where each location is given a color (Salinas is red, Imperial Valley is green and Yuma is blue). Nodes that have a mixture of soils have colors in between as depicted in the color bar. Sub-networks structure indicates that physical, chemical, and biological characteristics primarily segregate the samples according to location, with Salinas being most different from soils from Yuma and Imperial Valley, (B). The same network is colored by soilmanagement type (organic (represented by 0) vs. conventional (represented by 1). The red nodes represent samples with conventional soil management while the blue nodes represented the organic soil management. The green and orange colored nodes represented mixed organic and conventional soil management with varying percent of mixture of the two types of management. (C) Another network is built using the same parameters except for resolution. The soil samples are analyzed at a lower resolution to ask if structure (D) and the singleton will merge with any part of the sub-networks. Sub-network (D), which comprised of samples from Yuma and Imperial, became part of sub-network (B) (colored nodes). Samples from sub-network (D) are not part of the gray nodes. The singleton however remained a singleton. The size of each node reflects the number of data points contained in the node. For (A,B), the distance metric and filters were Person correlation and Principal Metric SVD and secondary metric SVD. Metric, Norm Correlation; Lens, Principal Metric SVD value (Resolution 30, Gain 4.0x, Equalized) Secondary Metric SVD Value (Resolution 30, Gain 4.0x, Equalized). For (C), all analysis parameters remained the same except for resolution (20 instead of 30).
