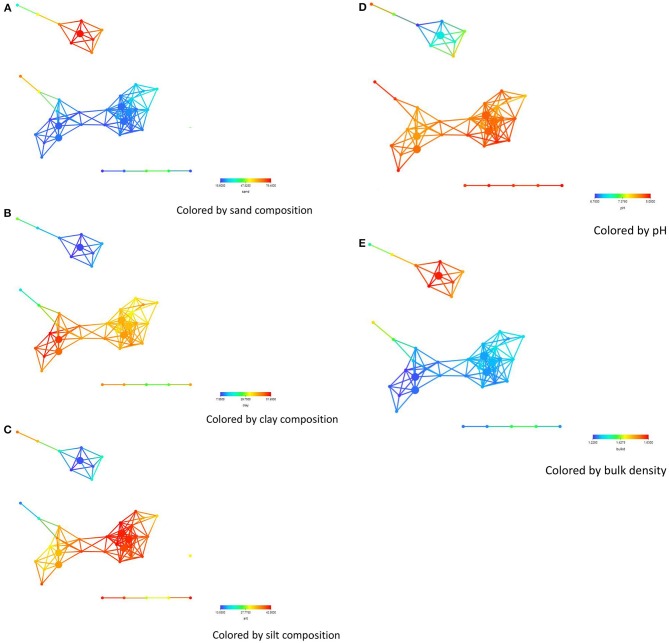
Figure 2.
Network colored by soil physical property concentrations-(A) sand, (B) clay, (C) silt, (D) pH, (E) bulk density. The legend below the figures shows ranges in concentrations of some of the soil physical properties. The distance metric and filters are as shown in the legend of Figure 1.

