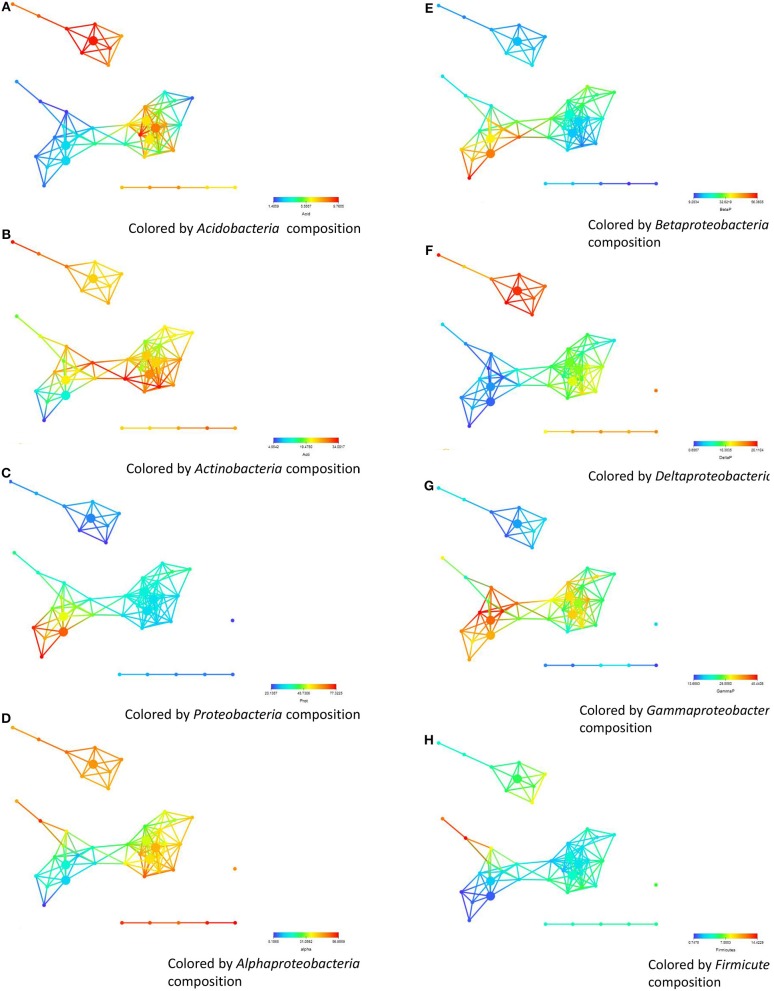
Figure 5.
The abundance and distribution of different bacterial phyla based on pyrosequencing and their correlation with survival. (A) soils from Salinas Valley region, sub-networks (B,C) Yuma and the Imperial region. (A–H) represent the coloring of the abundance of Actinobacteria, Acidobacteria, Firmicutes, Proteobacteria, Bacteroidetes, Alpha-, Beta-, Delta-, and Gammaproteobacteria, respectively. The distance metric and filters are as shown in Figure 1.

