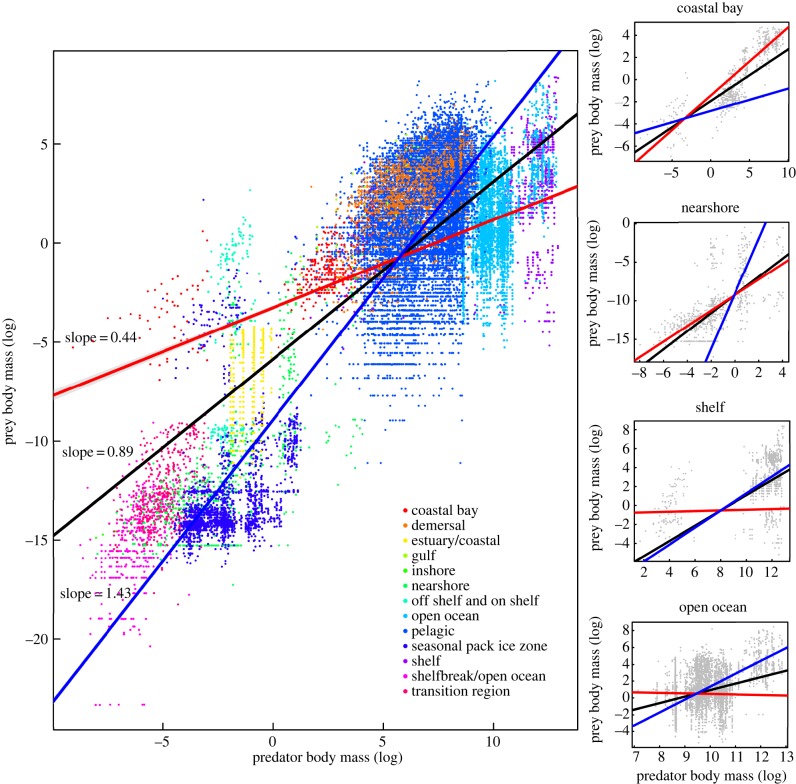
Figure 1.
Left: prey body size (log) against predator body size (log) across marine habitats. Red (T = 29°C), black (T = 15°C) and blue lines (T = −1.3°C) represent predicted curves from the best model. 95% confidence intervals are displayed in grey. Right: same as in left for a subset of the habitats studied (coastal bay is not significant). (Online version in colour.)

