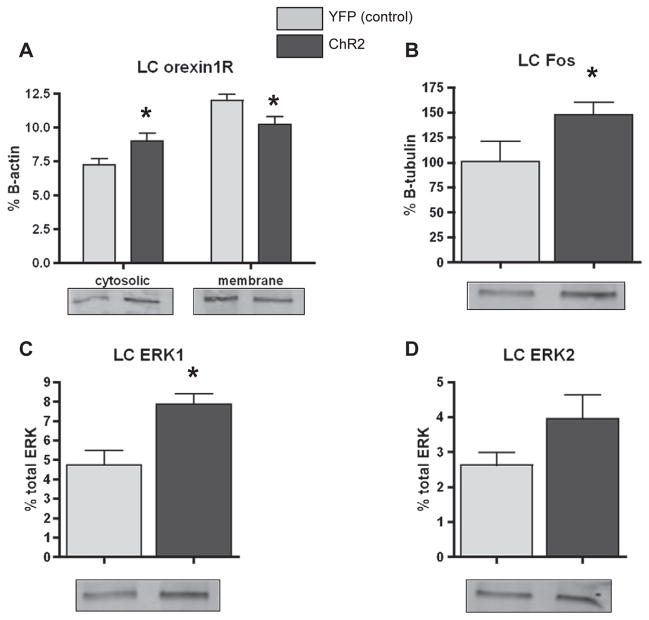
Fig. 5.
A) Western blot analysis of orexin1R expression in the cytosolic (left bars) and membrane (right bars) fractions of LC homogenates of Hcrt::YFP control (YFP; n = 9), and Hcrt:: ChR2-YFP (ChR2; n=13) transduced animals following hypothalamic photostimulation of 20Hz for 10s at a time every minute for 30min in their home cage. *=p<0.05 Hcrt::YFP control vs. Hcrt::ChR2-YFP. B) Western blot analysis of cFos expression in LC homogenates of animals described above. *=p<0.05 Hcrt::YFP control vs. Hcrt::ChR2-YFP. C) Western blot analysis of ERK1 phosphorylation expressed as % total ERK in LC homogenates of animals described above. * = p < 0.05 Hcrt::YFP control vs. Hcrt::ChR2-YFP. D) Western blot analysis of ERK2 phosphorylation expressed as % total ERK in LC homogenates of animals described above. In each graph, representative blots are shown for each group.

