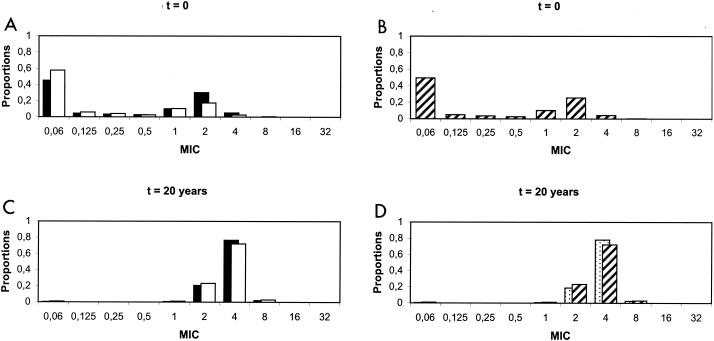
FIG. 3.
Currently observed distributions of penicillin MICs in France (A and B) and predicted distributions after 20 years of vaccination with a seven-valent conjugate vaccine (C and D). (A and C) Solid bars represent the distributions of MICs for vaccine serotypes of S. pneumoniae, and open bars represent those for nonvaccine serotypes. (B and D) Overall distributions of MICs for S. pneumoniae. In panel D, the hatched bars represent predictions with vaccination, whereas the stippled bars show predictions without vaccination.

