
Figure 2. Sample CLIP autoradiograms (step 34).
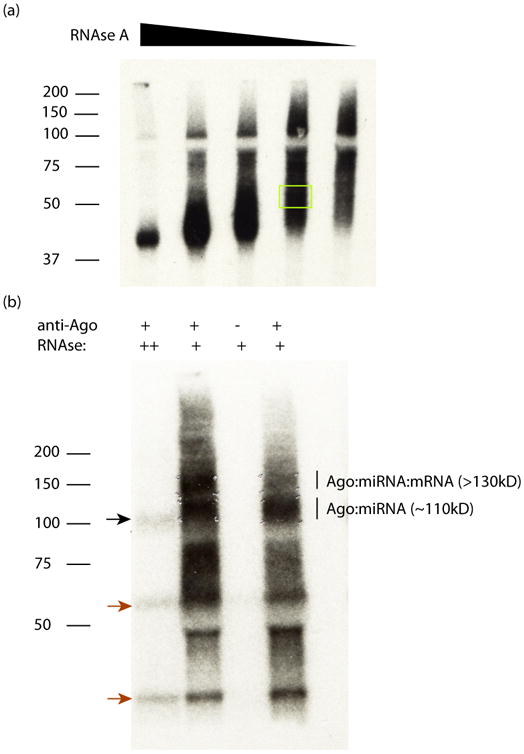
(a) An autoradiogram is shown for CLIP of the RBP TIA1 purified from human CD4+ T-cells. A RNAse titration was performed, which shows the overdigested complex in the leftmost lane running as a single band near the predicted MW (∼42 kD), and a smear extending upwards for progressively lower RNAse concentrations. The yellow box indicates an appropriate region to cut out for RNA extraction. (b) An autoradiogram is shown for CLIP of Ago from human T-cells, using the monoclonal 2A8 pan-Ago antibody. The first lane is an overdigested control, showing the ∼110kD band (black arrow). At lower RNAse concentrations (lanes 2 and 4), two populations are visible: the ∼110 kD Ago:miRNA complex, and the >130 kD Ago:miRNA:mRNA complex. Lane 3 is a control mouse IgG, showing the dependence of signal on 2A8. Note that contaminant bands (red arrows) are present in 2A8 IPs; the SDS-PAGE size selection is critical to diagnose and remove these contaminants.