
Figure 3. Sample RT-PCR from Ago CLIP experiments (step 71).
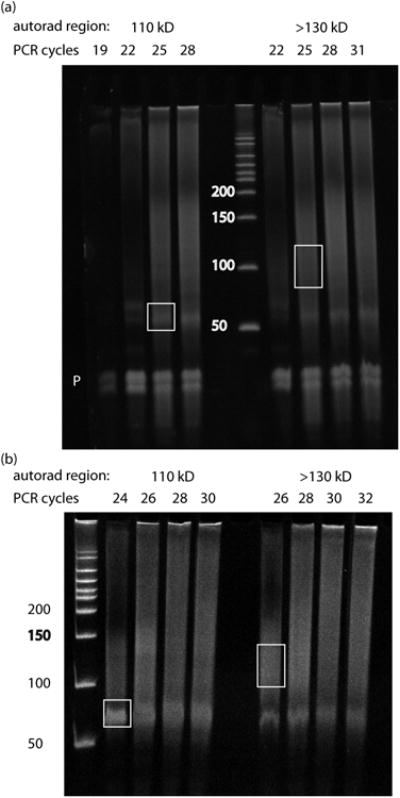
Two examples of RT-PCR from Ago HITS-CLIP experiments are shown, using samples from mouse T-cells (a) and mouse brain (b). In each case the 110 kD and >130 kD complexes were processed separately after isolation of RNA from the nitrocellulose membrane. PCR cycle numbers for each reaction are indicated above the gel. DNA size markers are indicated in bp. White boxes indicate gel regions that were excised and processed for high-throughput sequencing, as described in Anticipated Results. The ‘P’ in (a) indicates ‘primer-only’ products running below 50 bp, emphasizing the need for size selection and gel purification of appropriately sized products at this step. Primer-only products were run out of the gel in (b). Note that for the 110 kD complex, robust amplification of the ∼60 bp miRNA-dependent product occurs at earlier PCR cycles than for the >130 kD complex. Similarly, mRNA-dependent products, ideally a diffuse smear in the range from 85-110 bp, are enriched in the >130 kD complex. There is substantial cross-contamination between these populations, the degree of which varies according the resolution achieved at the SDS-PAGE step. However, we have found that separate, parallel isolation of these populations achieves higher complexity of mRNA tags, which represents a much more complex pool of sequences than the miRNA tags. Finally, note that products were excised from the lowest PCR cycles tested that gave robust signal. Plateaued signal and upward shift in modal size are indications of overamplification. Overamplification of tags, even by 1-2 cycles, can substantially reduce tag complexity.