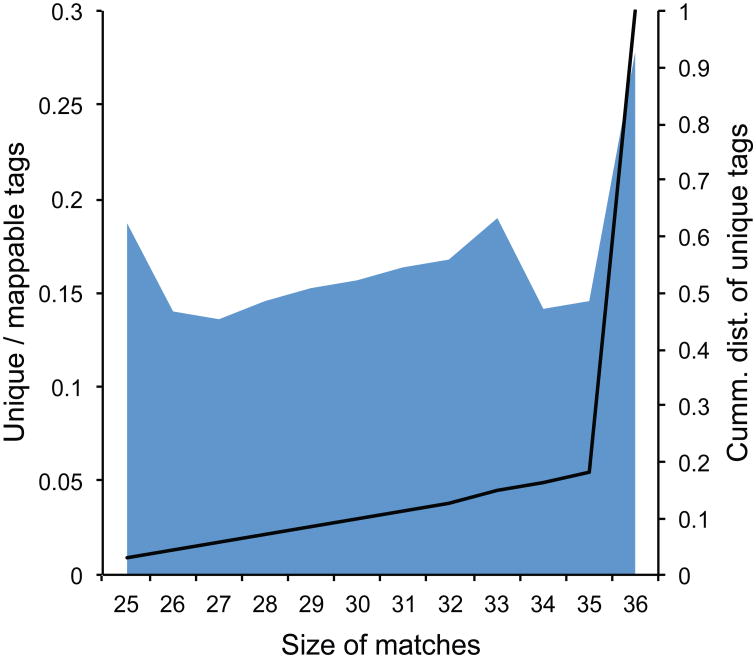
Figure 4. Proportion of unique CLIP tags among all reads unambiguously mapped to the reference genome with regard to the size of the matched region (step 97).
This proportion (shaded area, left axis) will increase when less stringent filtering and mapping criteria are used, which is not observed here. The curve on the right axis shows cumulative proportion of unique tags. In this case, a vast majority of tags have long matched regions, another indication of the high signal-to-noise in the obtained unique tags after removal of PCR duplicates.

