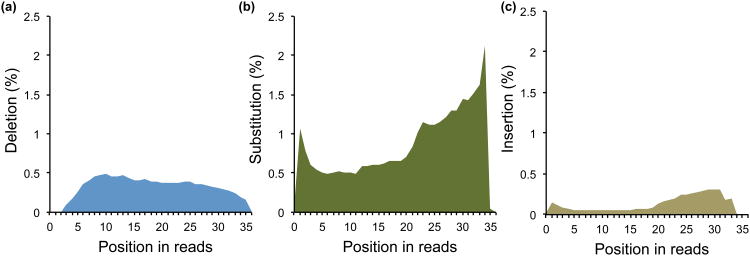
Fig. 5. The positional profiles of each type of mutation relative to 5′ end of reads (step 105).
The y-axis shows the percentage of unique tags with a particular type of mutation in each position. (a) deletions; (b) substitutions; (c) insertions. The U shaped distribution for substitutions and deletions is characteristic of the positional sequencing error profile of the Illumina platform, while a higher rate of deletion in the middle (peaked at around positions 5-15) is a signature of protection from RNase digestion by the RNABP binding footprint.

