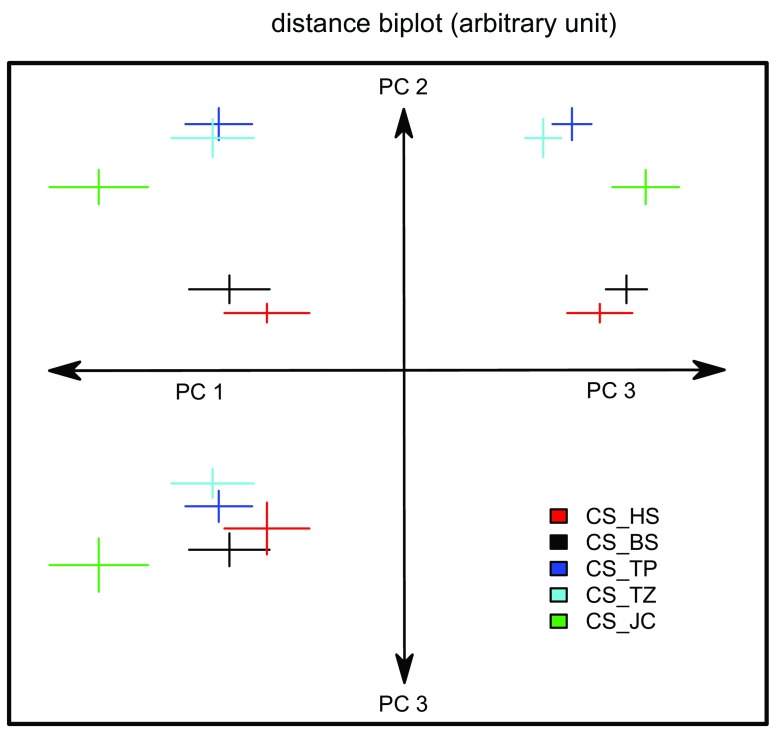
Figure 2. The CS sub-strains can be separated into three groups according to their overall behavior in Buridan’s paradigm.
A PCA was performed over the 12 measured variables capturing the flies’ locomotion. The three first principal components are plotted against each other: from the center of the axes; PC1 to the left, PC2 up and PC3 down and to the right. Since units are arbitrary, they were not indicated. For each genotype, we represent the mean and standard error of the mean for the different PCs as a colored cross (data from the two replicates were pooled). The three groups are best visualized separately on the PC2-PC3 plot (upper-right), while PC2 is sufficient to separate the three groups statistically (see text). Sample size for each group is 23–28.

