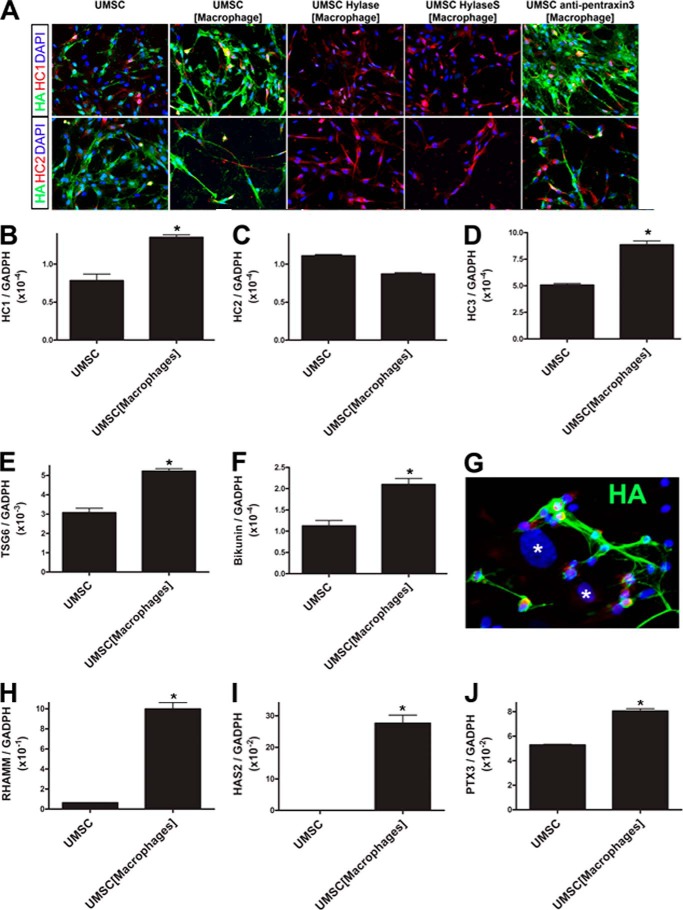
FIGURE 10.
Immunolocalization of HA, HC1, and HC2 in UMSCs exposed to inflammatory cells. UMSCs were treated or not with Hylase or HylaseS and placed in co-culture with inflammatory cells seeded in a transwell insert with a 0.44-μm pore. A, localization of HA, HC1, and HC2 was evaluated by immunocytochemistry. UMSCs were placed in co-culture with inflammatory cells using the transwell system and left for 24 h, after which RNA was extracted from the UMSCs in the bottom chamber. Real time PCR analysis was done to verify the expression levels of HC1 (B), HC2 (C), HC3 (D), TSG6 (E), bikunin (F), RHAMM (H), HAS2 (I), and pentraxin 3 (J). G, inflammatory cells were seeded directly over UMSCs to study the adhesion of the inflammatory cells to UMSC HA-rich cables (green). Nuclei were counterstained with DAPI (blue), and * represents the nuclei of UMSCs. B–J, *, p ≤0.05.

