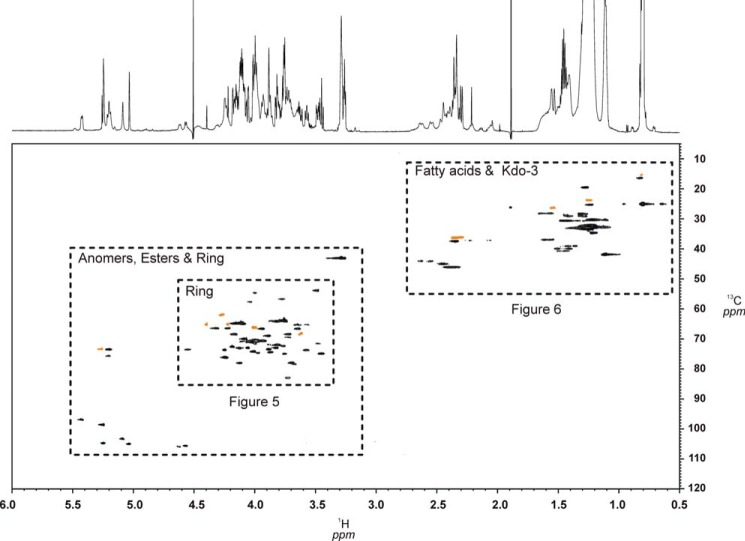
FIGURE 4.
HSQC-contour plot of the complete spectrum (1H 6.0–0.5 ppm, 13C 120–5 ppm) in which all three distinct regions of 3 can be clearly distinguished. Ring protons/carbon signals and those of fatty acids are enlarged in Fig. 5 and 6, to demonstrate good signal resolution. Signals from the DHPC-d40 (98% D) detergent are shown in orange. The 1H NMR spectrum is shown along the F2 axis at the top.

