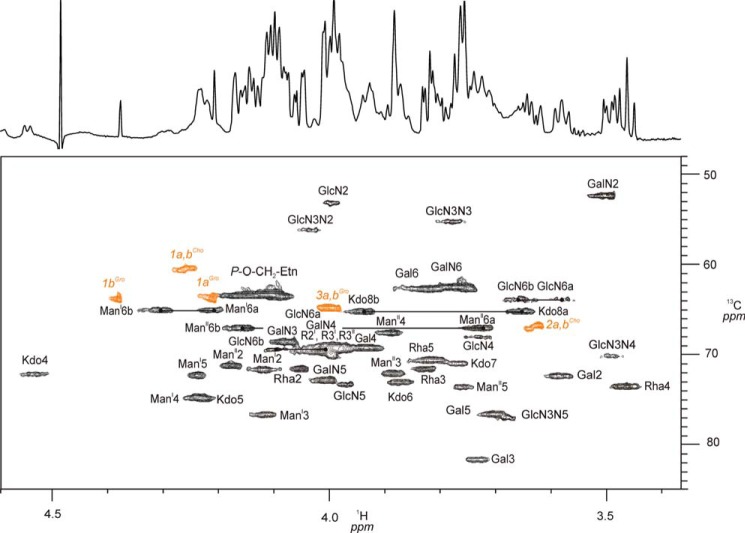
FIGURE 5.
Section of the 1H,13C-HSQC NMR (700 MHz) spectrum showing ring proton/carbon signals of 3. The spectrum was recorded at 325 K in D2O containing 1.5% DHPC-d40. Selected 1H,13C ring signals and their assignments are indicated. 1H,13C signals from the DHPC-d40 detergent (98% D) are shown in orange. The one-dimensional 1H spectrum is shown as a projection of the F2 axis.

