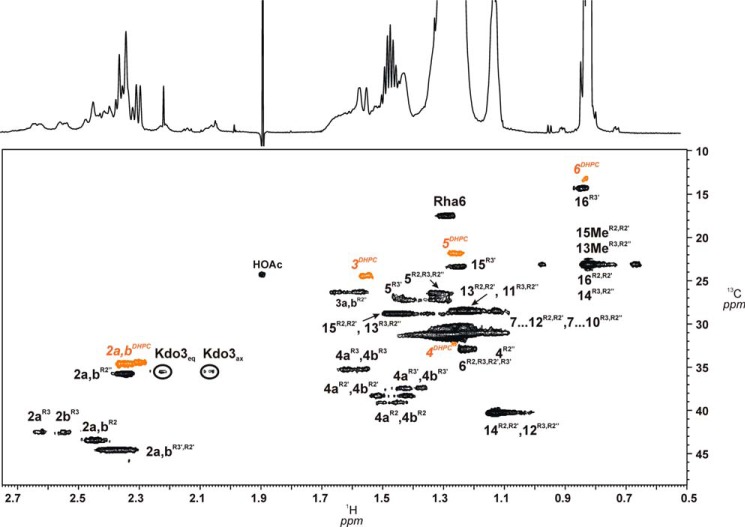
FIGURE 6.
HSQC contour plot showing the region with fatty acid signals H-2/C-2 to H-ω/C-ω as well as H-3ax,eq/C-3 Kdo and H-6/C-6 of l-Rha sugars. Signals assigned to one acyloxyacyl residue (R2″-R2′), (3R)-3-(15-methyl-hexadecanoyloxy)-13-methyl-tetradecanoic acid, attached to position 2′ of GlcpN3N (II) as well as those originating from the (R)-3-hydroxy-hexadecanoic acid (R3′) are indicated. Signals from the DHPC-d40 detergent are shown in orange.

