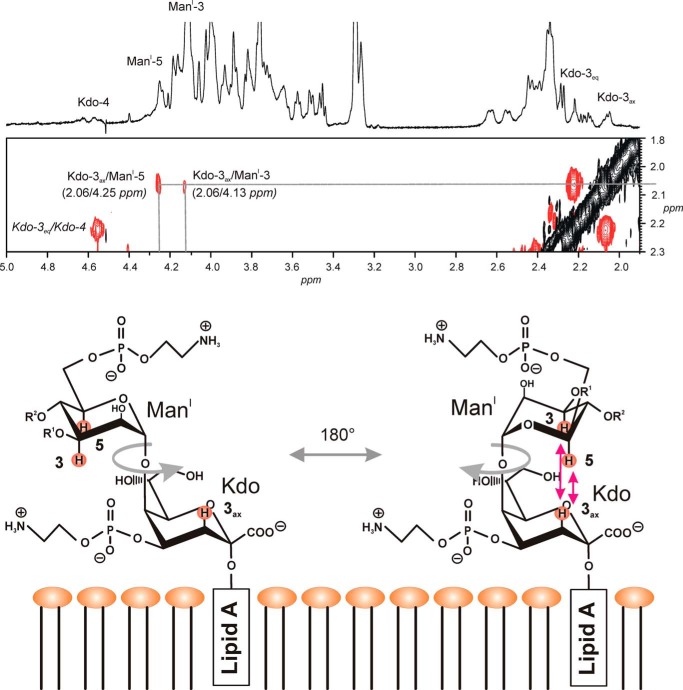
FIGURE 8.
Special conformation adopted by the intact core when bound to the lipid A. Shown is part of the ROESY spectrum of 3 with NOE signals showing interresidual connectivities between H-3ax of Kdo and H-3/H-5 of ManI. This indicates a free rotation in the core oligosaccharide of about 180° (gray arrow) around the ManI-C1-O-C5-Kdo bond axis as shown in the bottom part together with the membrane matrix of the DHPC micelles. Indicated are the two disaccharides attached to ManI (i.e. α-l-Rhap-(1→3)-β-d-Galp-(1→ (OR1) and α-d-GalNp-(1→6)-α-d-ManpII-(1→4) (OR2)).

