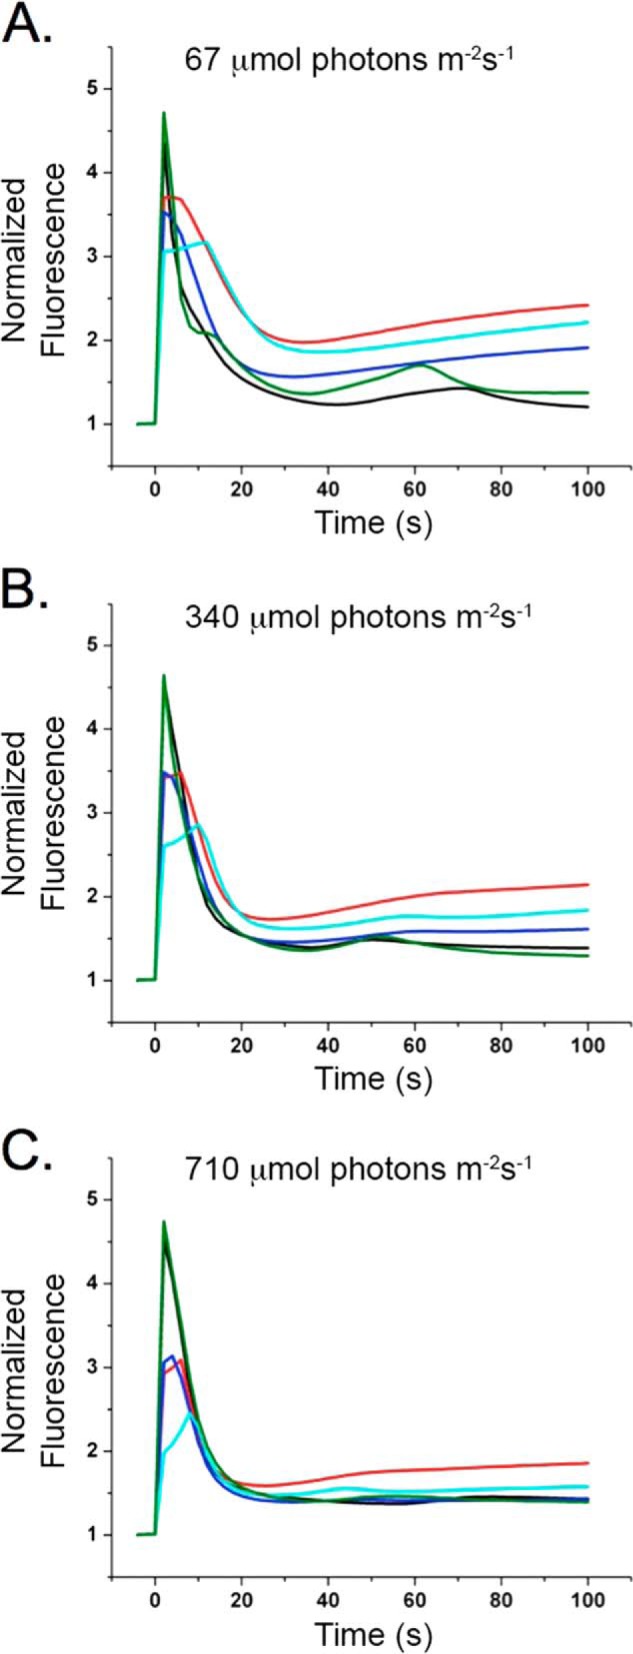
FIGURE 3.

Chlorophyll fluorescence induction measurements. Wild-type and mutant PPD1 RNAi-E, -F, -H, and -J chlorophyll fluorescence induction at 67 (A), 340 (B), and 710 μmol of photons m−2 s−1 (C). Values were normalized to F0. Colors correspond to plants as follows: wild type (black) and mutant PPD1 RNAi-E (red), -F (blue), -H (cyan), and -J (green).
