FIGURE 10.
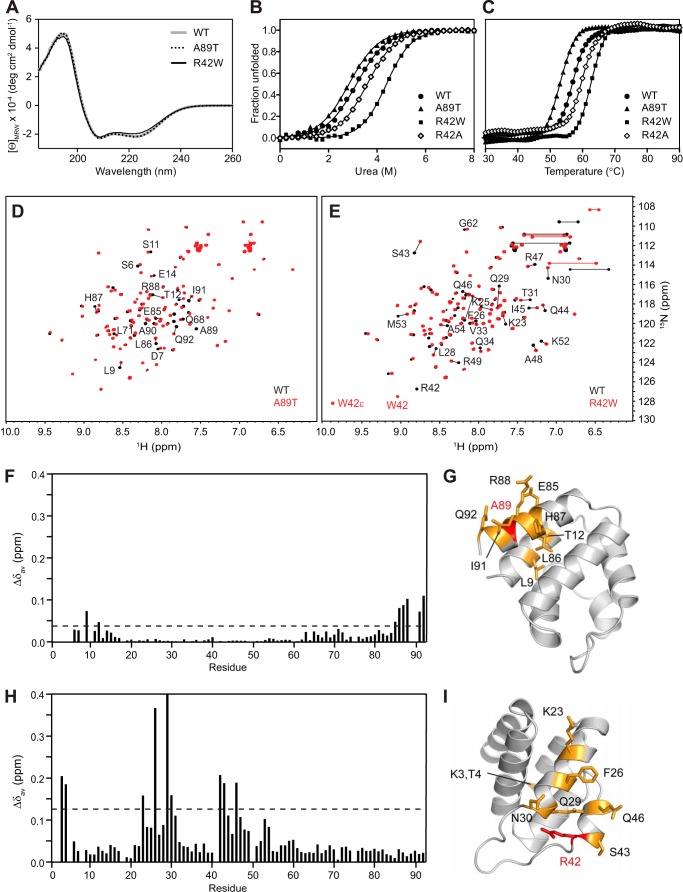
Effects of FMF-associated mutations on the structure and stability of pyrin PYD. A, far-UV CD spectra of WT (gray line), A89T mutant (dotted black line), and R42W mutant (solid black line) pyrin PYDs. B and C, purified WT and mutant pyrin PYDs were subjected to chemical denaturation with urea (B) or thermal denaturation (C). Filled circles, WT; filled triangles, A89T; filled squares, R42W; open diamonds, R42A. In B, the data were fitted to a two-state unfolding model (56), and the fraction of unfolded protein was plotted as a function of urea concentration. D and E, overlay of the two-dimensional 1H-15N HSQC spectra of wild-type (black) and mutant (red) pyrin PYD proteins A89T and R42W, respectively. All spectra were recorded in 50 mm sodium phosphate, pH 4, and 150 mm NaCl at 25 °C. Residues that show chemical shift changes are indicated with the one-letter amino acid code and sequence number. Horizontal lines connect peaks corresponding to side chain NH2 groups of Asn and Gln residues that exhibit changes in chemical shifts. In E, the peaks corresponding to the Trp42 backbone NH and side chain NH (W42ϵ) are labeled. F and H, histograms of the weighted backbone amide chemical shift changes (Δδav) versus residue number for the A89T and R42W pyrin PYD mutants, respectively. The dashed line indicates one standard deviation higher than the mean Δδav value (0.04 and 0.14 ppm, respectively). G and I, ribbon diagrams of the pyrin PYD structure showing residues with chemical shifts perturbed by the A89T and R42W mutations, respectively. Mutated residues are colored red, and residues with chemical shift changes greater than one standard deviation above the mean Δδav are colored orange, and their side chains are shown.

