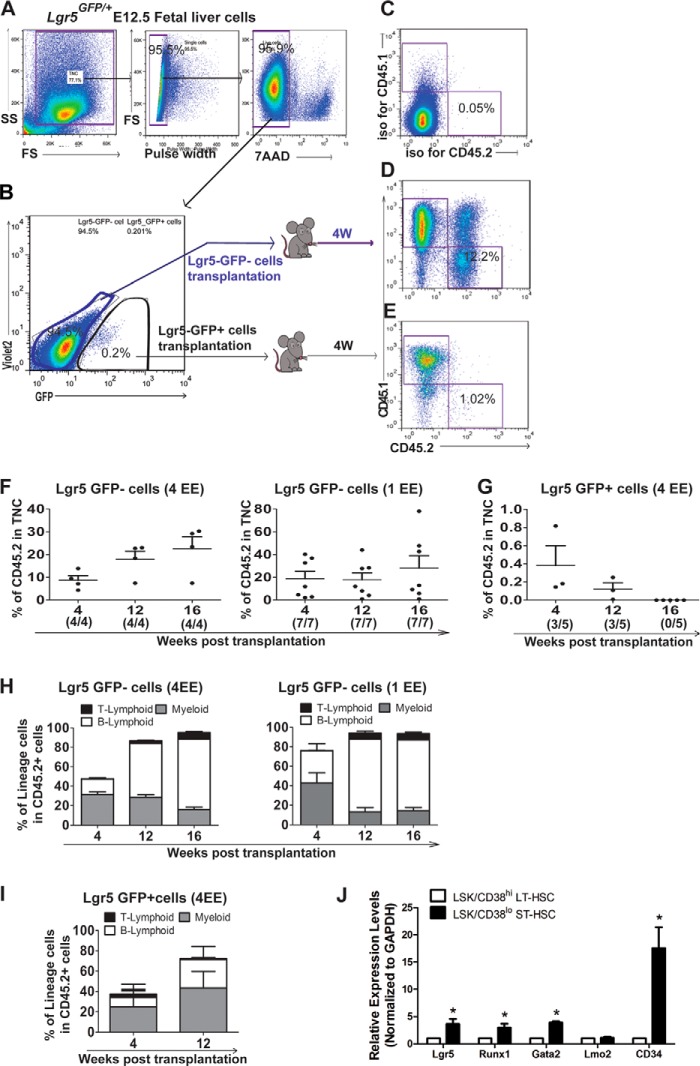
FIGURE 4.
Functional characterization of Lgr5-GFP+ cells using repopulation assay. A, single live (7AAD−) cells were gated from Lgr5GFP/+E12.5 fetal liver cells (CD45.2). B, Lgr5-GFP+ and Lgr5-GFP− cells derived from a whole liver were further sorted and injected into irradiated (9Gy) adult recipient mice with rescue cells (CD45.1), respectively. The peripheral blood was collected for repopulation assay 4 weeks post-transplantation. C, base level of engraftment was set up using an isotype control antibody staining. D, representative flow cytometry plots showing the population of Lgr5-GFP−-derived cells (CD45.2). E, representative flow cytometry plots showing the population of Lgr5-GFP+ -derived cells (CD45.2). F, bar graphs showing the engraftment of donor cells (Lgr5-GFP− cells) at 4, 12, and 16 weeks post-transplantation (4/4 and 7/7 indicate how many mice out of transplanted recipients showed engraftment after 4 and 1 EE of donor cells injection). G, bar graphs showing the engraftment of donor cells (Lgr5-GFP+ cells) at 4, 12, and 16 weeks post transplantation (3/5 and 0/5 indicate how many mice out of transplanted recipients showed engraftment). H, bar graphs showing the percentage of myeloid and lymphoid lineage cells in Lgr5-GFP−-derived cells. I, bar graphs showing the percentage of myeloid and lymphoid lineage cells in Lgr5-GFP+-derived cells. J, bar graphs showing relative expression level of Lgr5, Runx1,Gata2, Lgr4, Lmo2, and CD34 genes in sorted ST-HSCs (CD38loLSK) from fetal liver.

