
FIGURE 6.
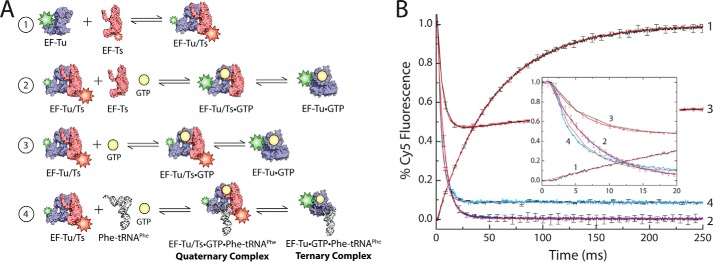
Significant amounts of EF-Tu/Ts remain bound to GTP under physiological nucleotide concentrations. A, schematic illustrating the EF-Tu/Ts FRET assay. 1, Cy3-labeled EF-Tu (blue) is added to Cy5-labeled EF-Ts (red). 2, EF-Tu(Cy3)/Ts(Cy5) mixed with unlabeled EF-Ts and GTP. 3, EF-Tu(Cy3)/Ts(Cy5) added to GTP. 4, EF-Tu(Cy3)/Ts(Cy5) mixed with unlabeled Phe-tRNAPhe and GTP. B, 2 μm EF-Tu(Cy3) mixed with 2 μm EF-Ts(Cy5) while monitoring Cy5 fluorescence (curve 1), 2 μm EF-Tu(Cy3)/Ts(Cy5) added to 20 μm unlabeled EF-Ts and 1 mm GTP (curve 2), 2 μm EF-Tu(Cy3)/Ts(Cy5) mixed with 1 mm GTP (curve 3), and 2 μm EF-Tu(Cy3)/Ts(Cy5) mixed with 0.5 μm Phe-tRNAPhe and 1 mm GTP (curve 4). A plot focusing on the early time points in the reactions is shown for clarity (inset). Apparent rates were estimated by fitting to either a single exponential function (curves 1, 2, and 4) or a double exponential function (curve 3). Error bars represent the S.D. of three separate experiments.